Telegraf
Table of contents
Telegraf
Telegraf is an open source, plugin-driven collection agent for metrics and events. Telegraf allows you to:
- Collect data.
- Parse, aggregate, serialize, or process that data.
- Write it to a variety of data stores.
Like InfluxDB, it compiles into a single binary. The Telegraf agent and plugins are configurable through a single TOML configuration file. Telegraf is also database agnostic. It also has batching, caching, buffering, and jittering capabilities to ensure that your data collection and writes are successful. In other words, if you are looking for a tool to help you collect and write data, it’s worth taking a look at Telegraf.
There are 7 types of Telegraf plugins:
- Input Plugins: These plugins fetch data from a variety of input sources. There are over 200 input plugins to choose from.
- Output Plugins: These plugins format input data and writes them to a wide variety of data stores.
- Aggregator Plugins: These plugins emit aggregations of your data.
- Parser Plugins: These plugins help you to parse various data formats into line protocol.
- Processor Plugins: These plugins help you transform and filter metrics.
- Serializer Plugins: These plugins serialize data into a variety of formats.
- External Plugins: These plugins are community contributed plugins that utilize either the Telegraf execd input, output, or processor plugin. The execd plugins make Telegraf extensible in any language so you can collect data from, process data, and write data to any source.
Installing
To install Telegraf, visit the downloads page for Influxdata and select the platform type. Then copy and paste the commands in your command line. If you’re using a MacOS, then you can use Homebrew, a package manager, to install Telegraf with: brew update
brew install telegraf
Configuring and Running
There are two ways to configure Telegraf:
- Through the InfluxDB UI
- Though the command line
Through the InfluxDB UI
The InfluxDB UI also shines when it comes to onboarding new users, whether they’re an InfluxDB OSS or free tier InfluxDB Cloud user. The InfluxDB UI allows you to easily leverage Telegraf. You can use InfluxDB UI to select from hundreds of different Telegraf plugins, create a Telegraf configuration, and help them run Telegraf. You can also add additional plugins to an existing Telegraf configuration with the InfluxDB UI which provides users with all of the flexibility and power that Telegraf offers.
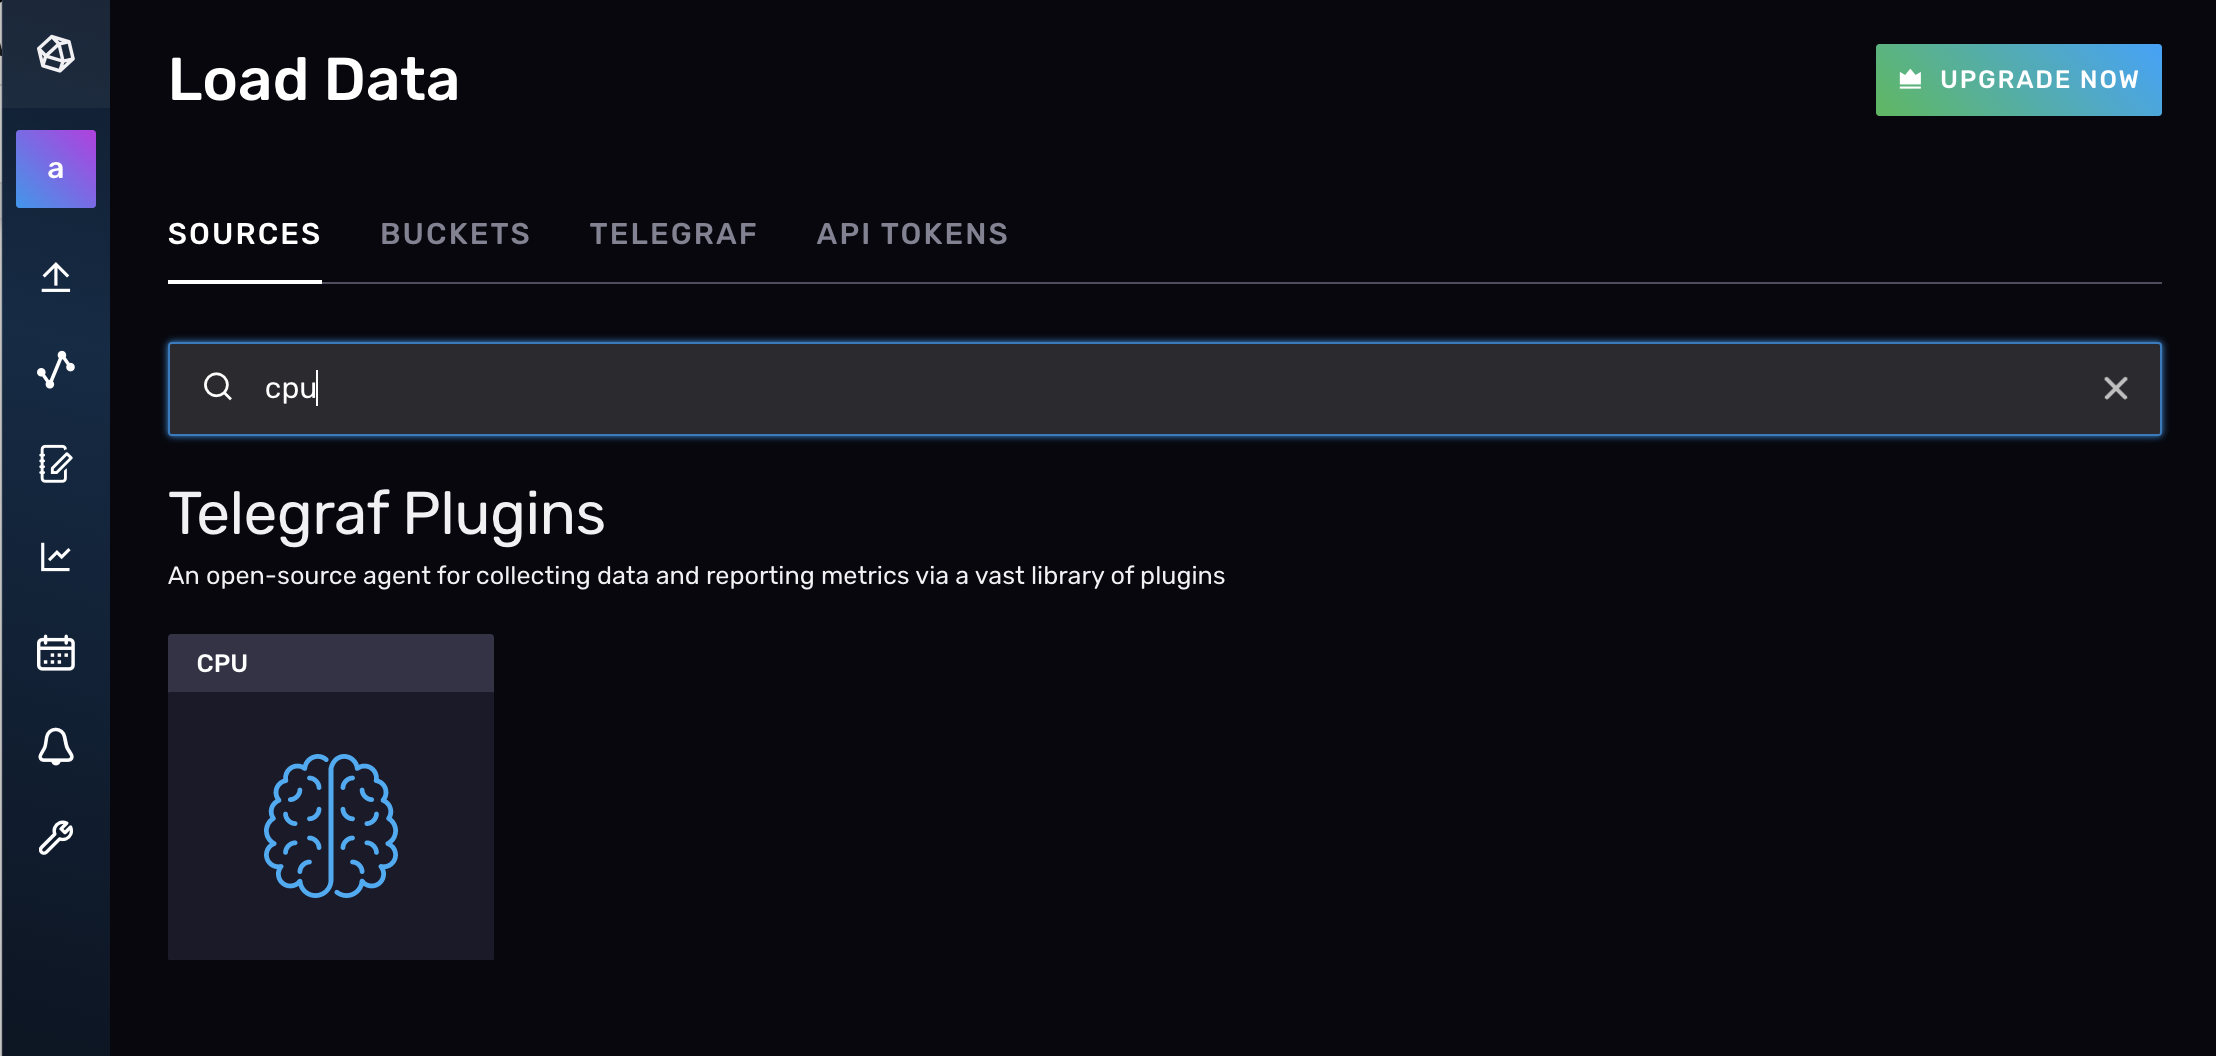
To create a Telegraf configuration in the InfluxDB UI, navigate to the Data tab and select the plugin you want to add under the list of Telegraf Plugins . Alternatively, you can also search for the plugin you want to use at the top of the Data tab. Let’s use the CPU Input Plugin, to gather CPU metrics from your machine.
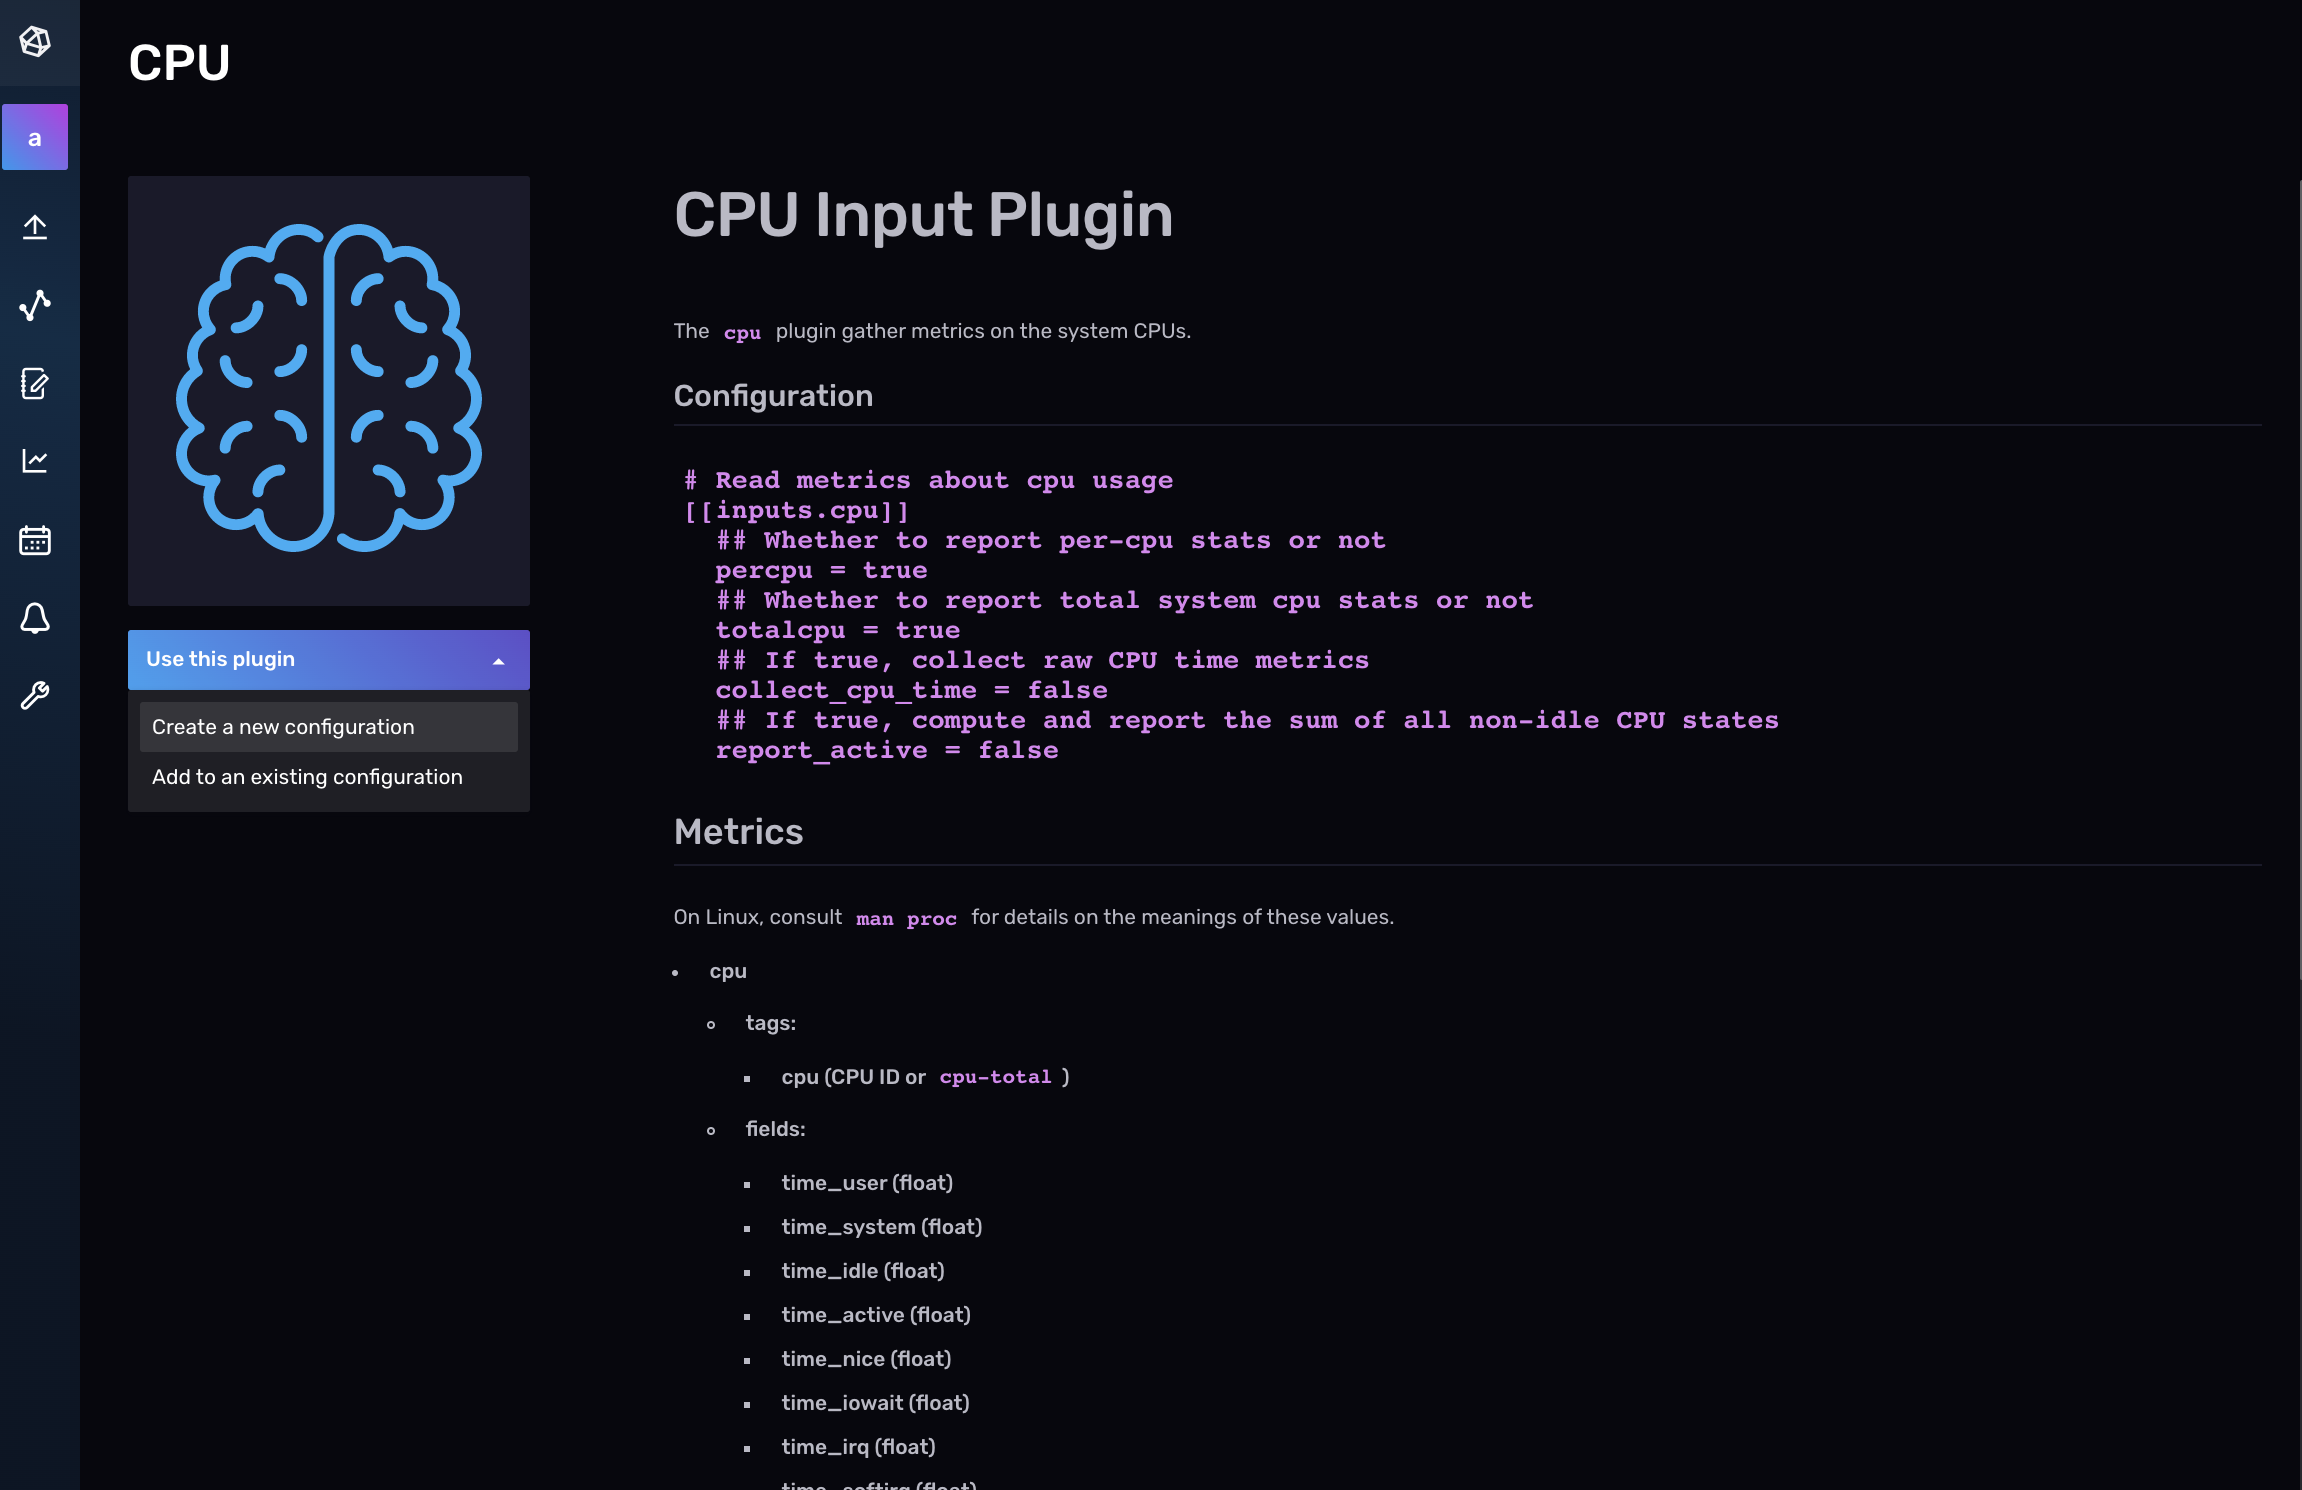
Next, select Create a configuration from the dropdown.
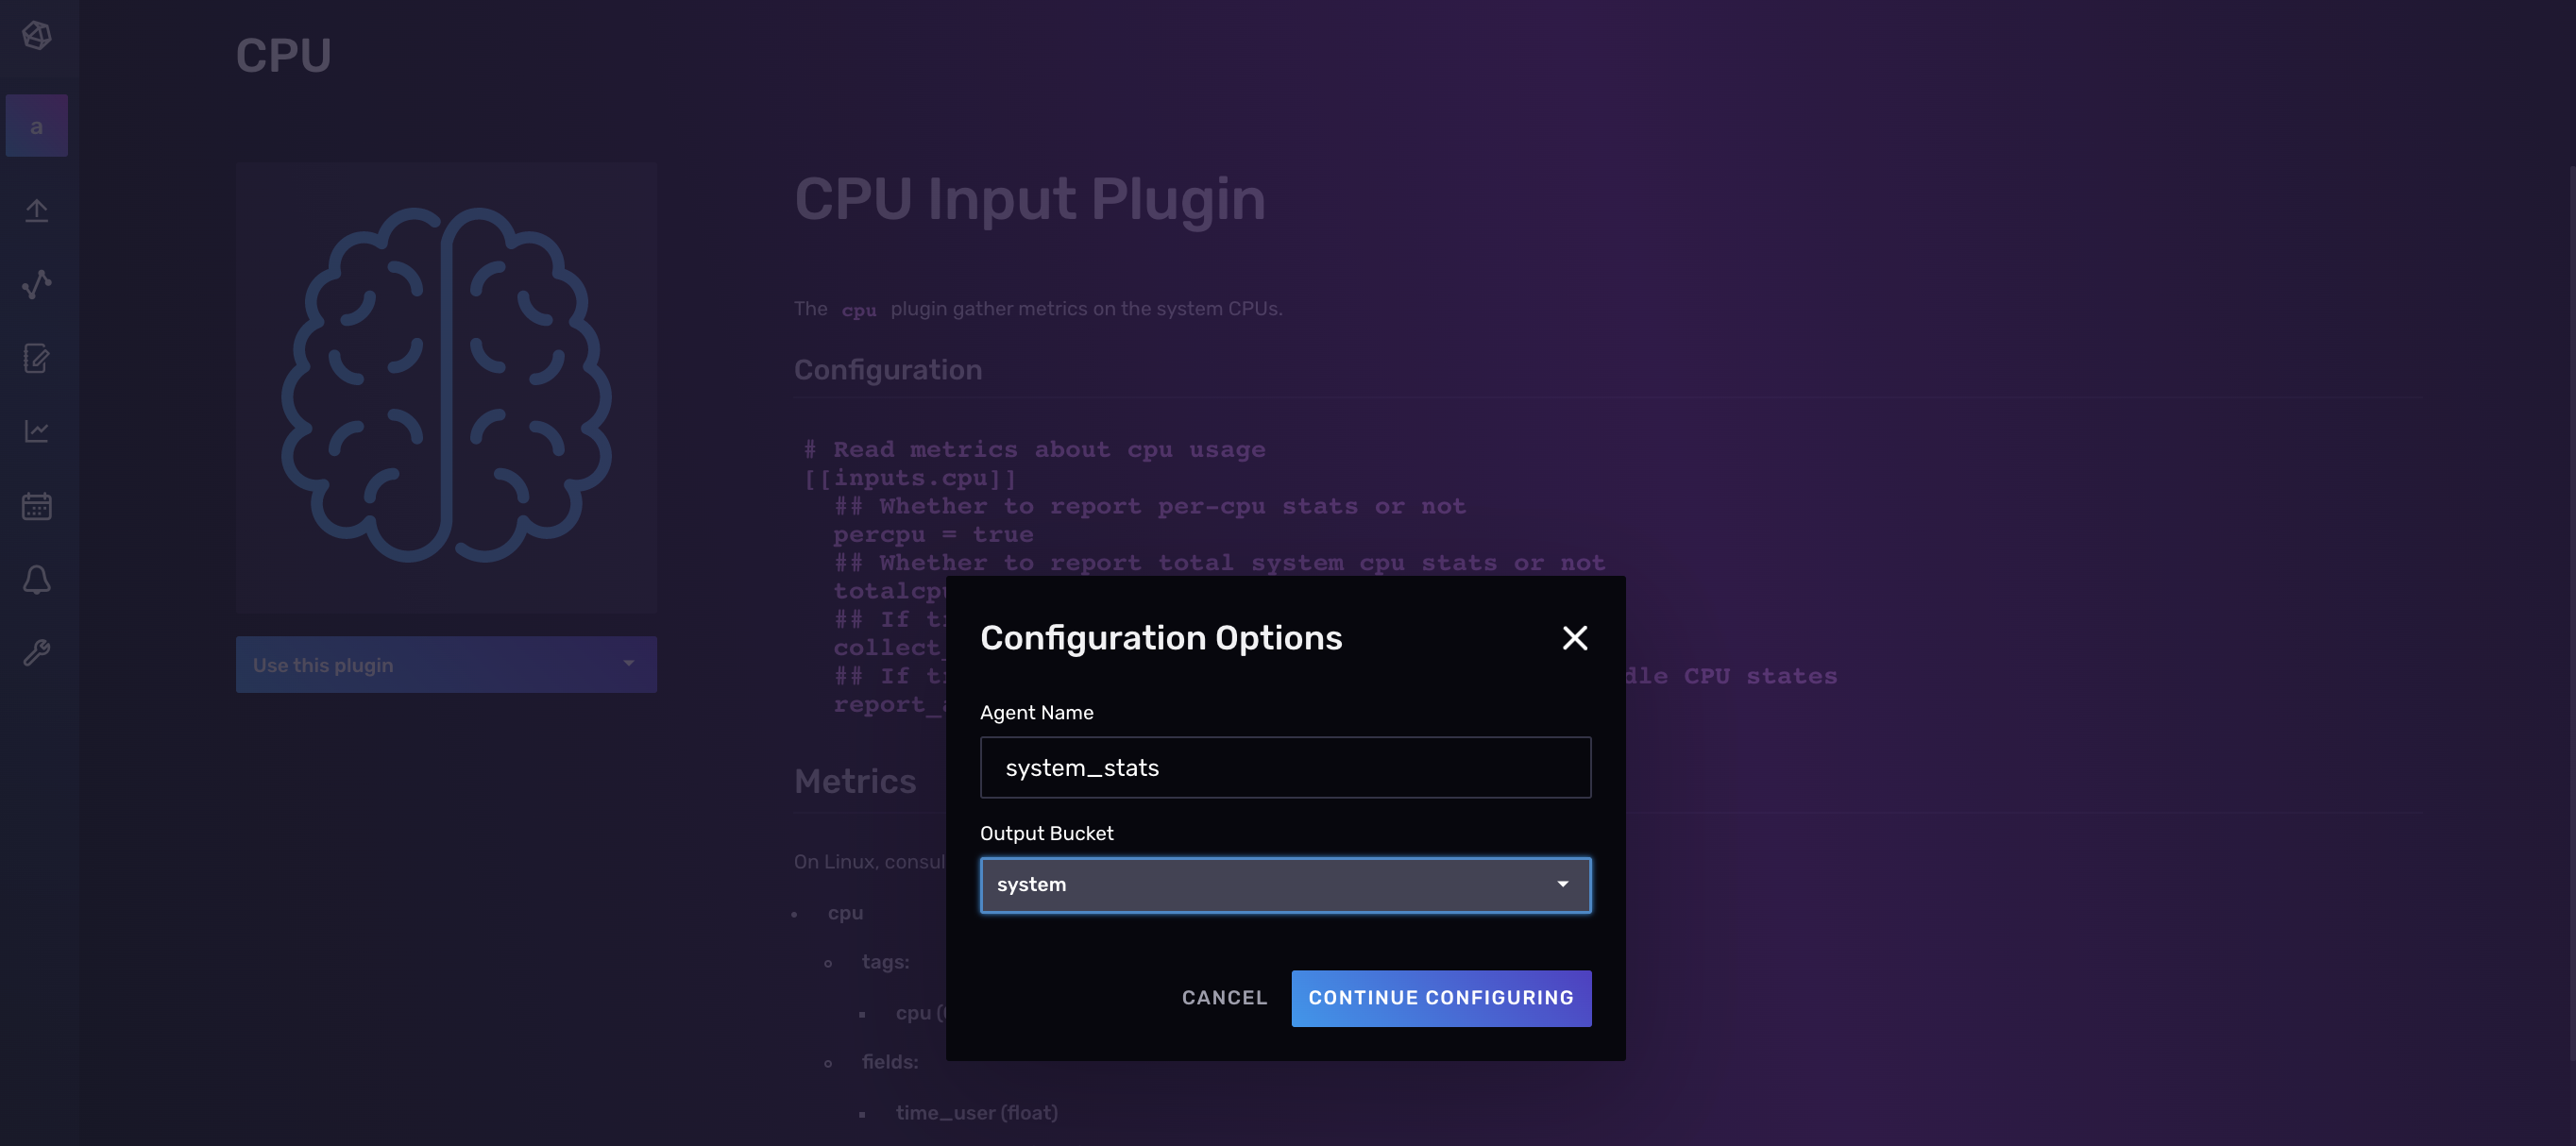
Now you can name your Telegraf config and either:
- Select the bucket that you want your Telegraf agent to write data to.
- Create a new bucket to write data to.
In the screenshot below, name your configuration, “system_stats”, and select your as output bucket, the “system”.
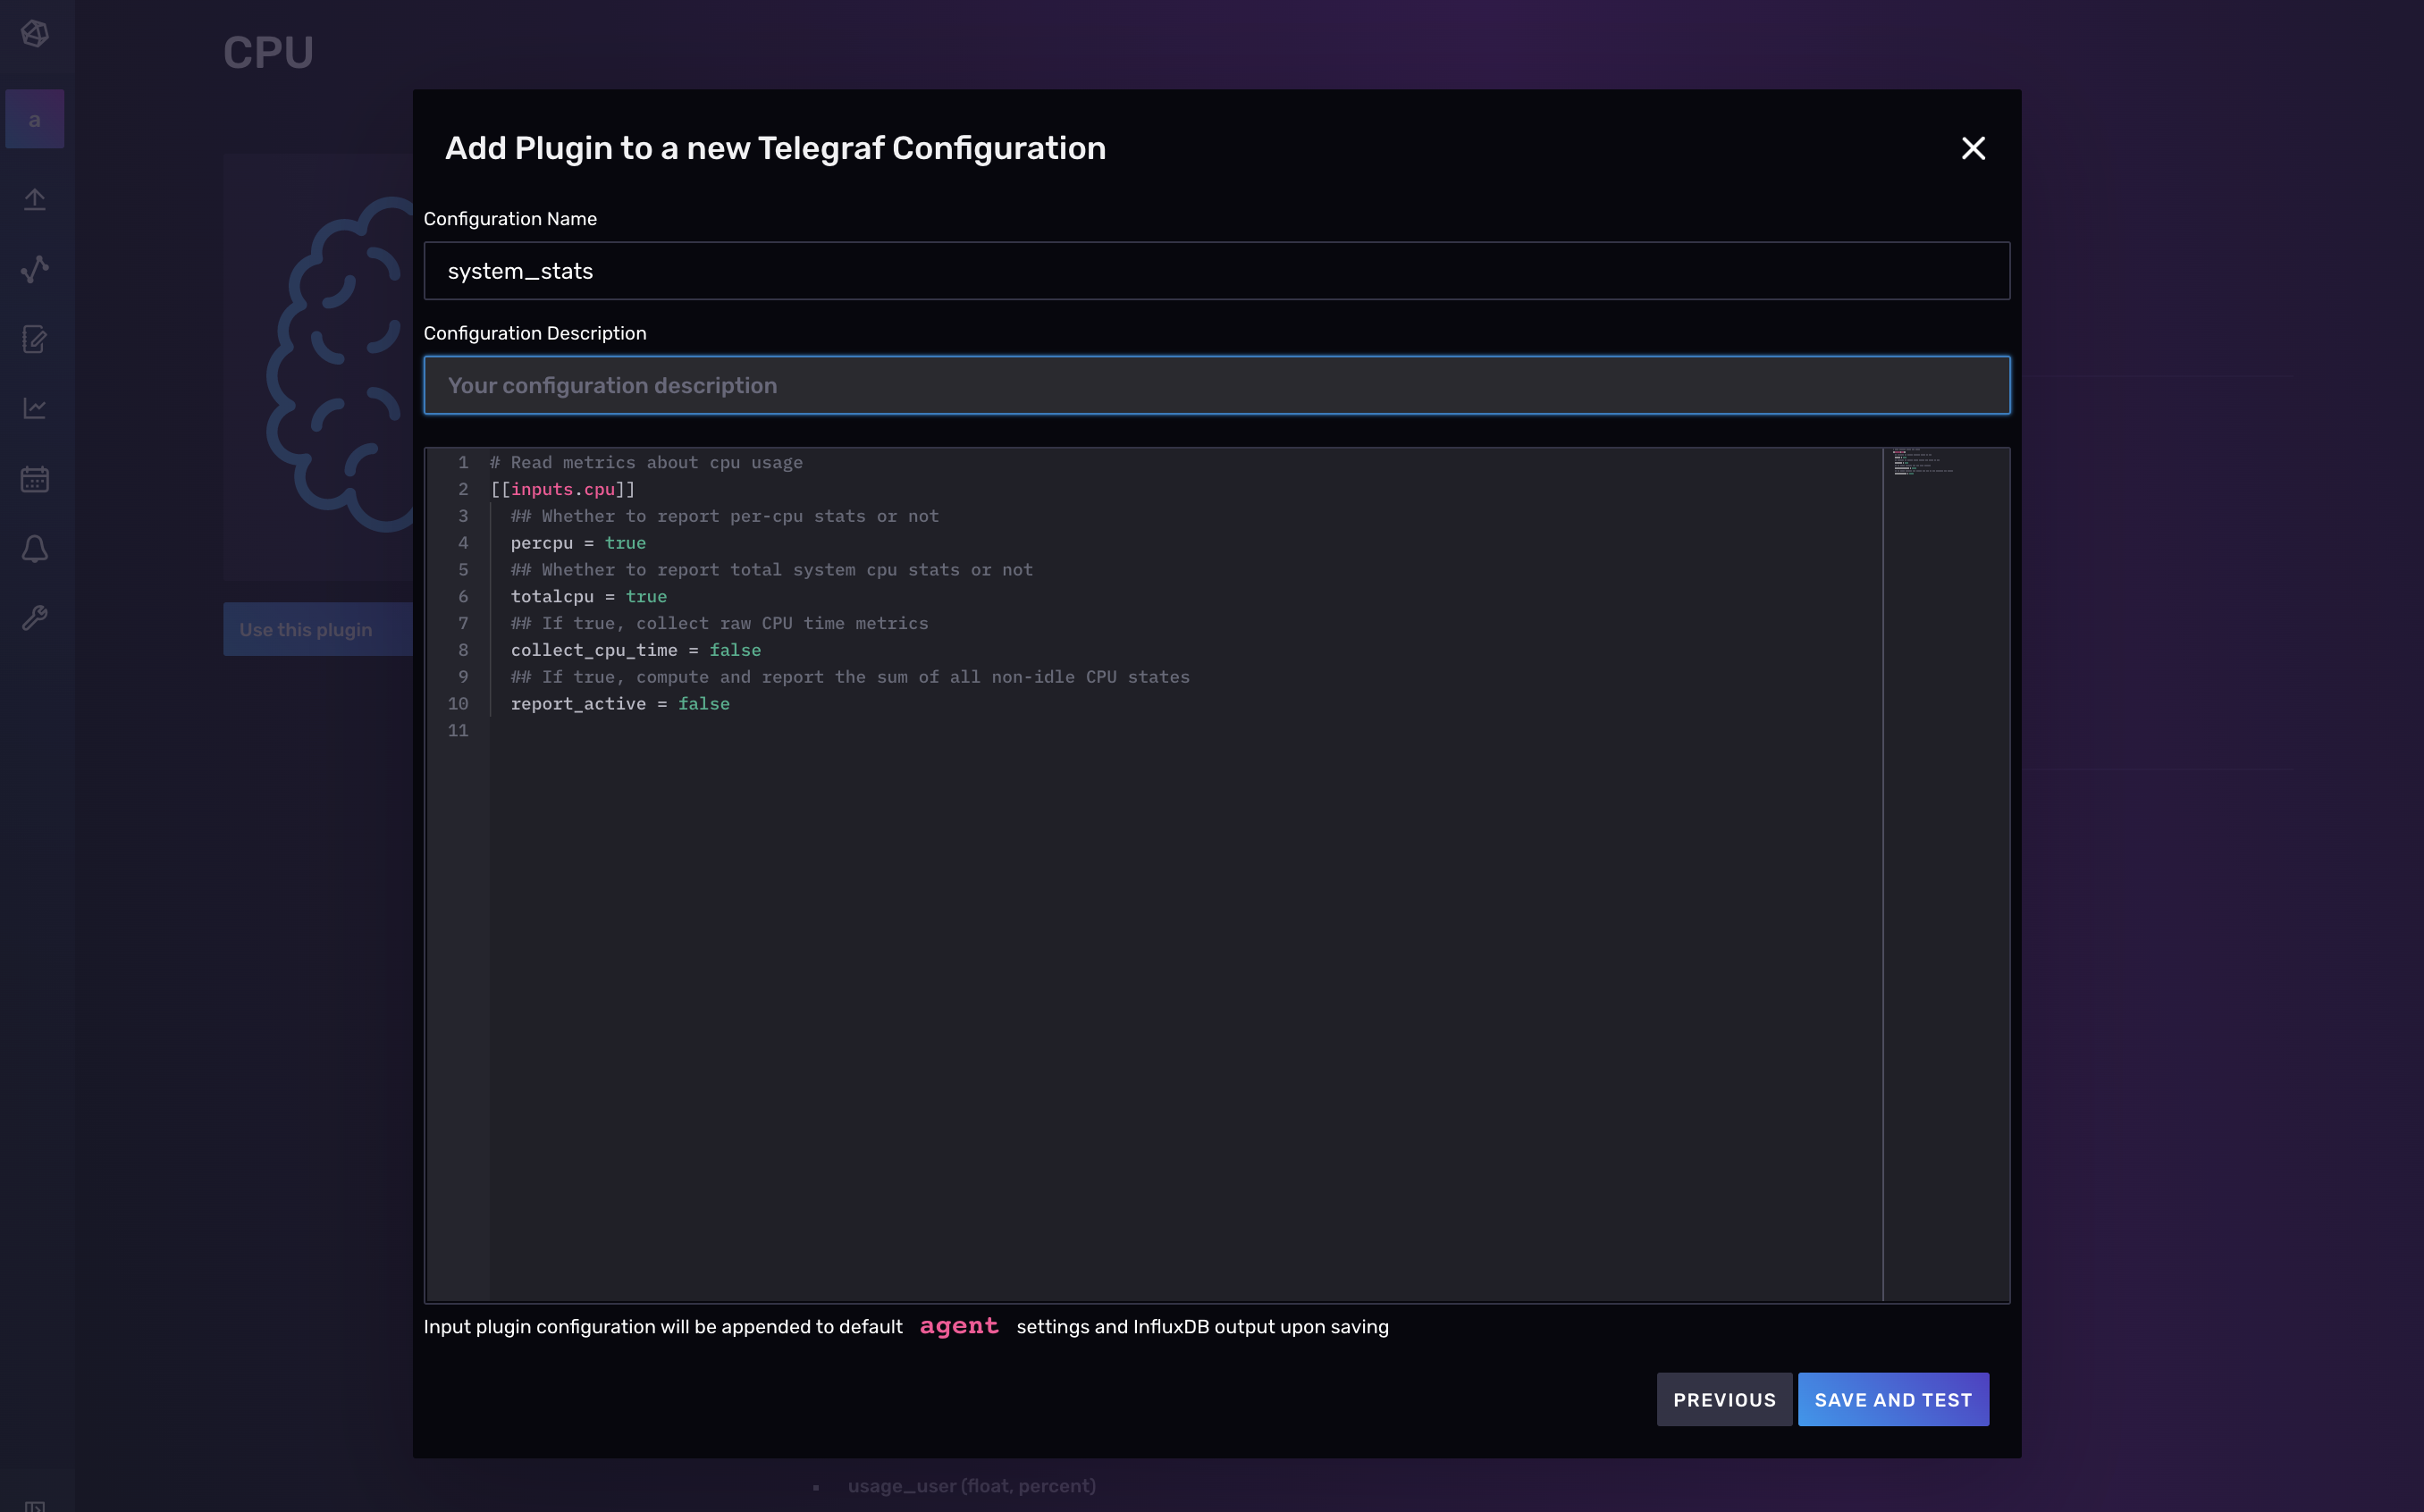
Select Continue Configuring to proceed to the next step where you can add a Telegraf configuration description (optional) and edit any portion of your configuration. To learn more about how to configure individual plugins, find your plugin and visit GitHub for documentation on your selected plugin.
Finally, click Save and Test to bring you to the setup instructions page. Follow those instructions to:
- Install Telegraf (if you haven’t already)
- Configure an API token
- Start Telegraf
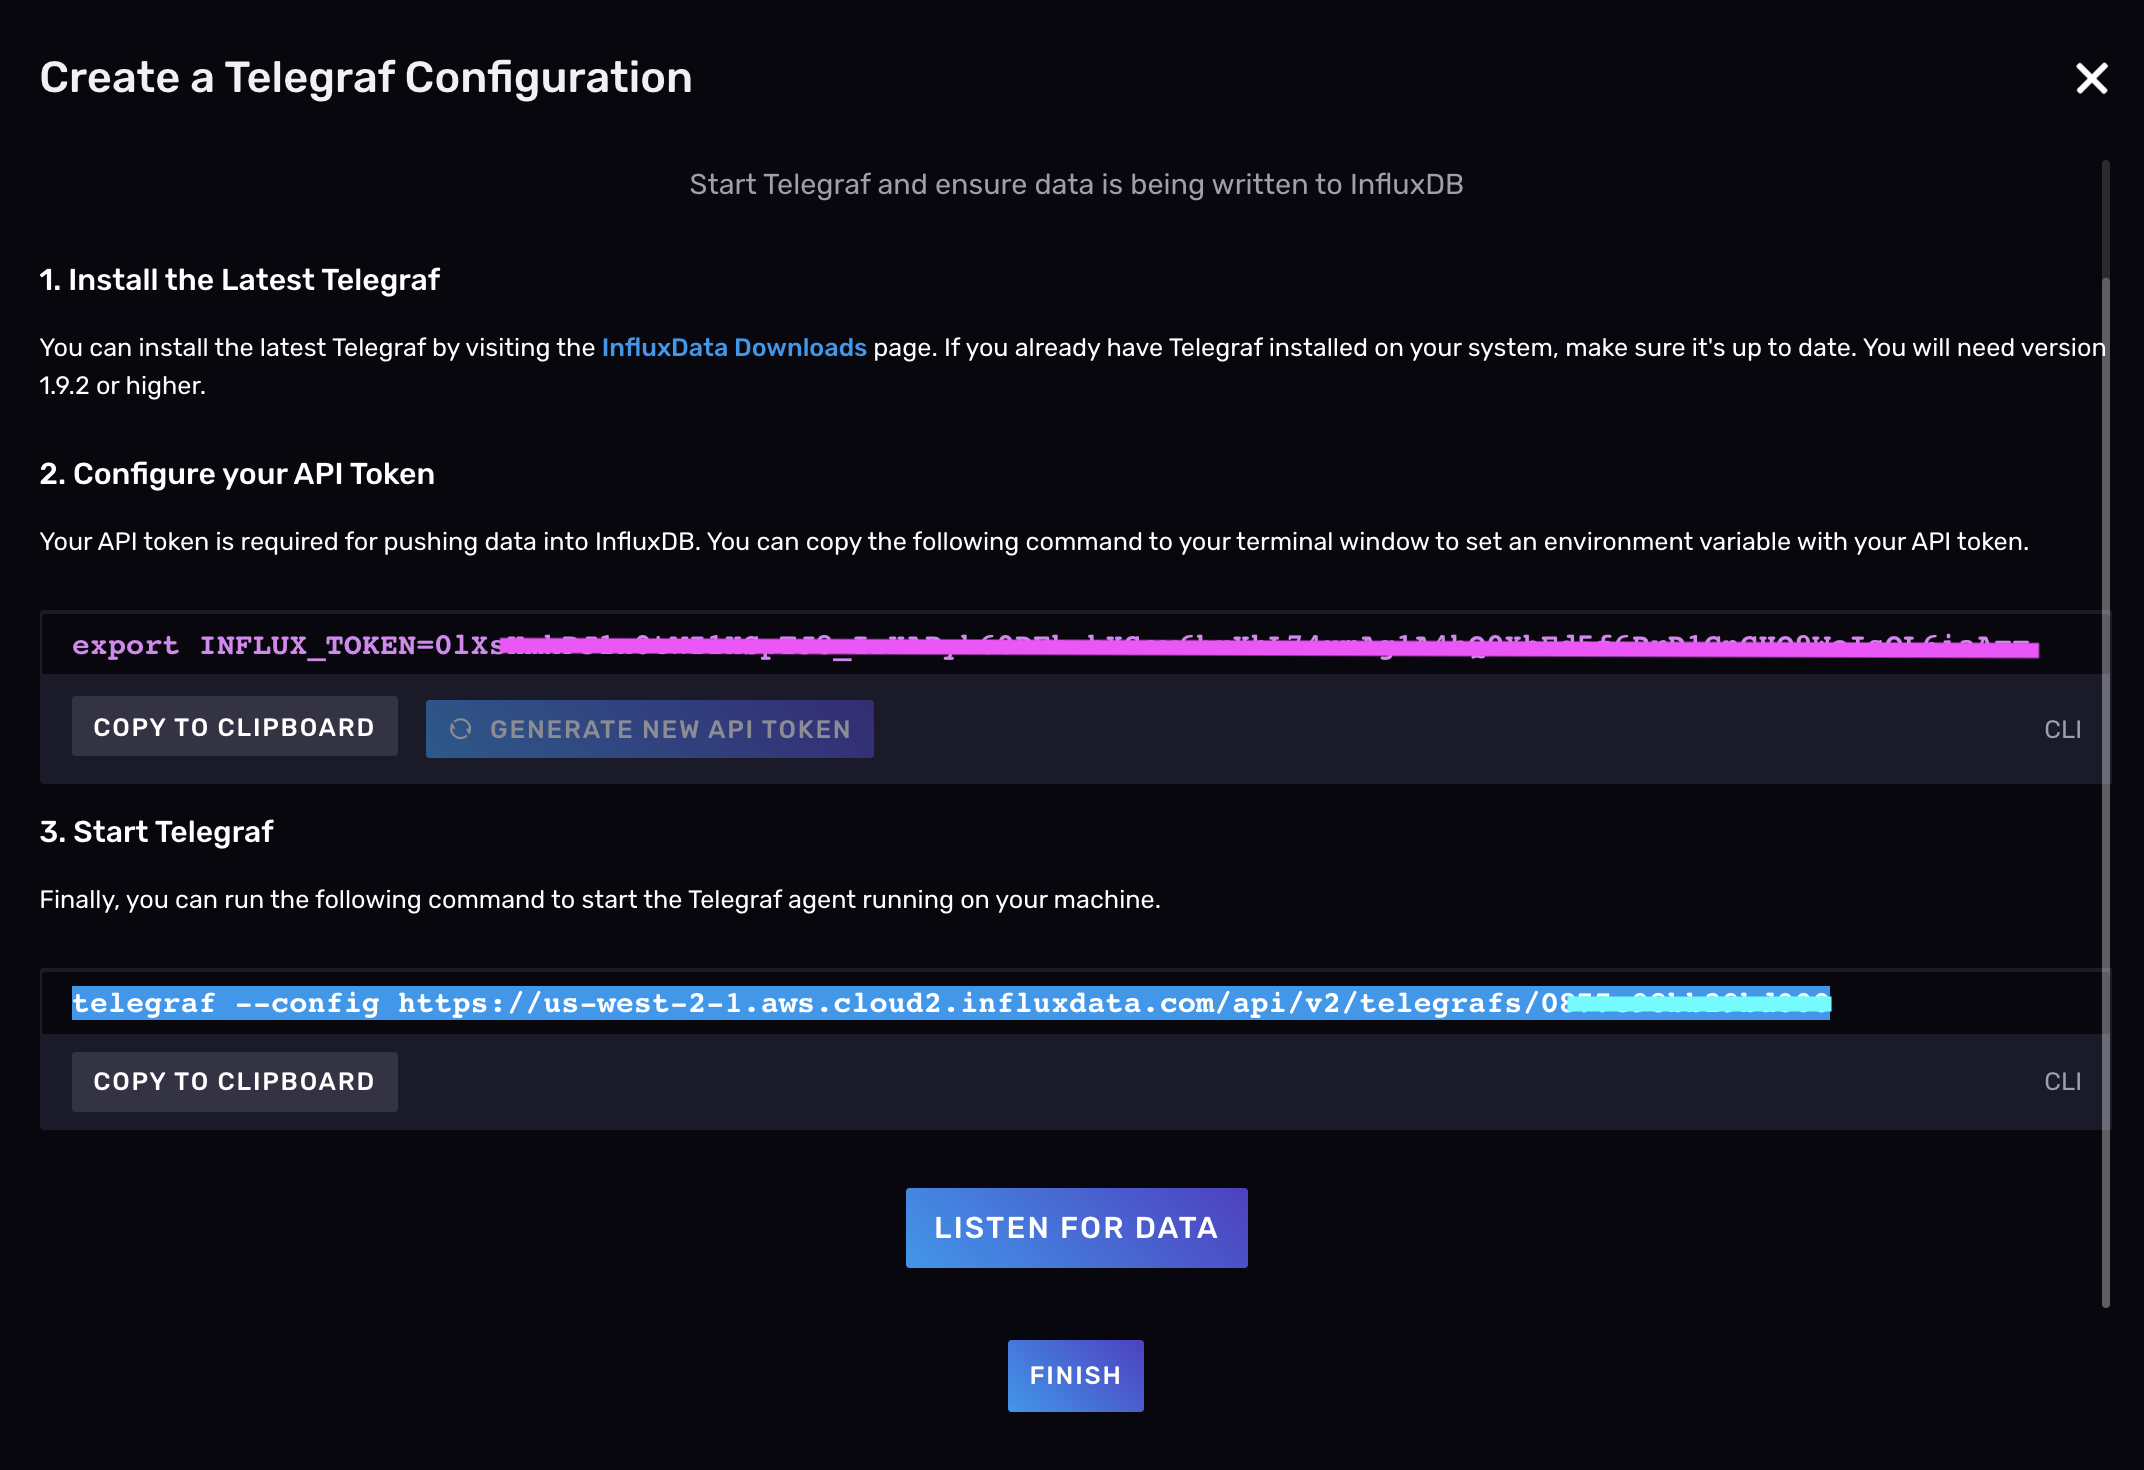
Click the Listen for Data button to verify that you’re successfully collecting and writing data with Telegraf.
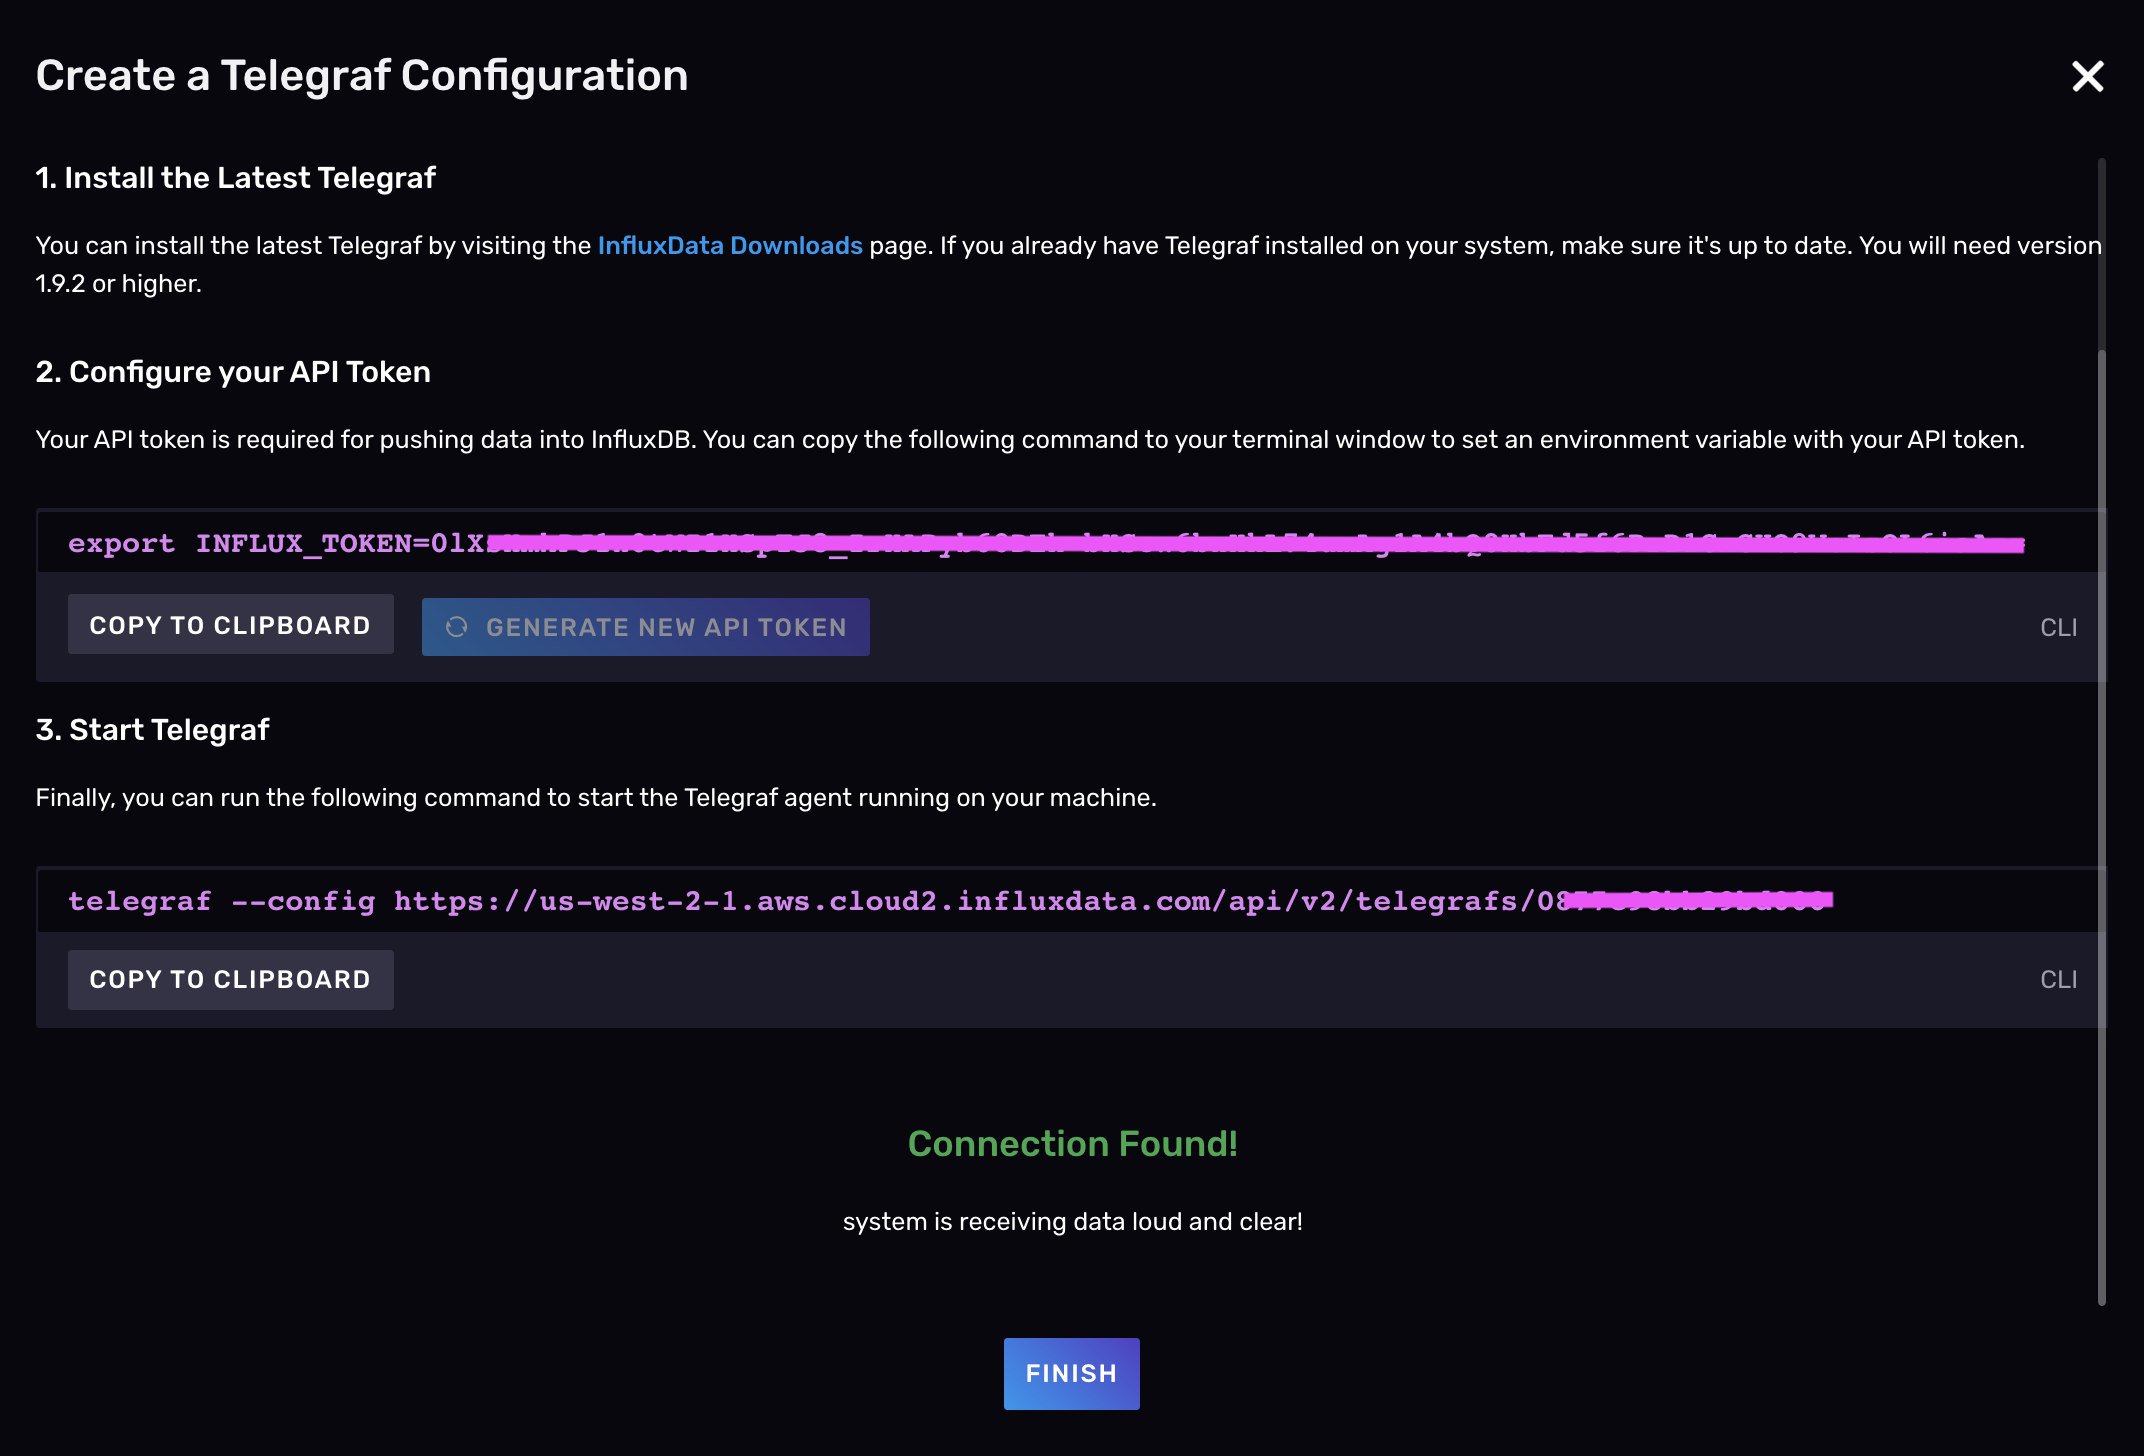
Hit Finish when you’re done to return to the Telegraf page where you can view a list of all of your Telegraf configurations and follow the setup instructions from there as well.
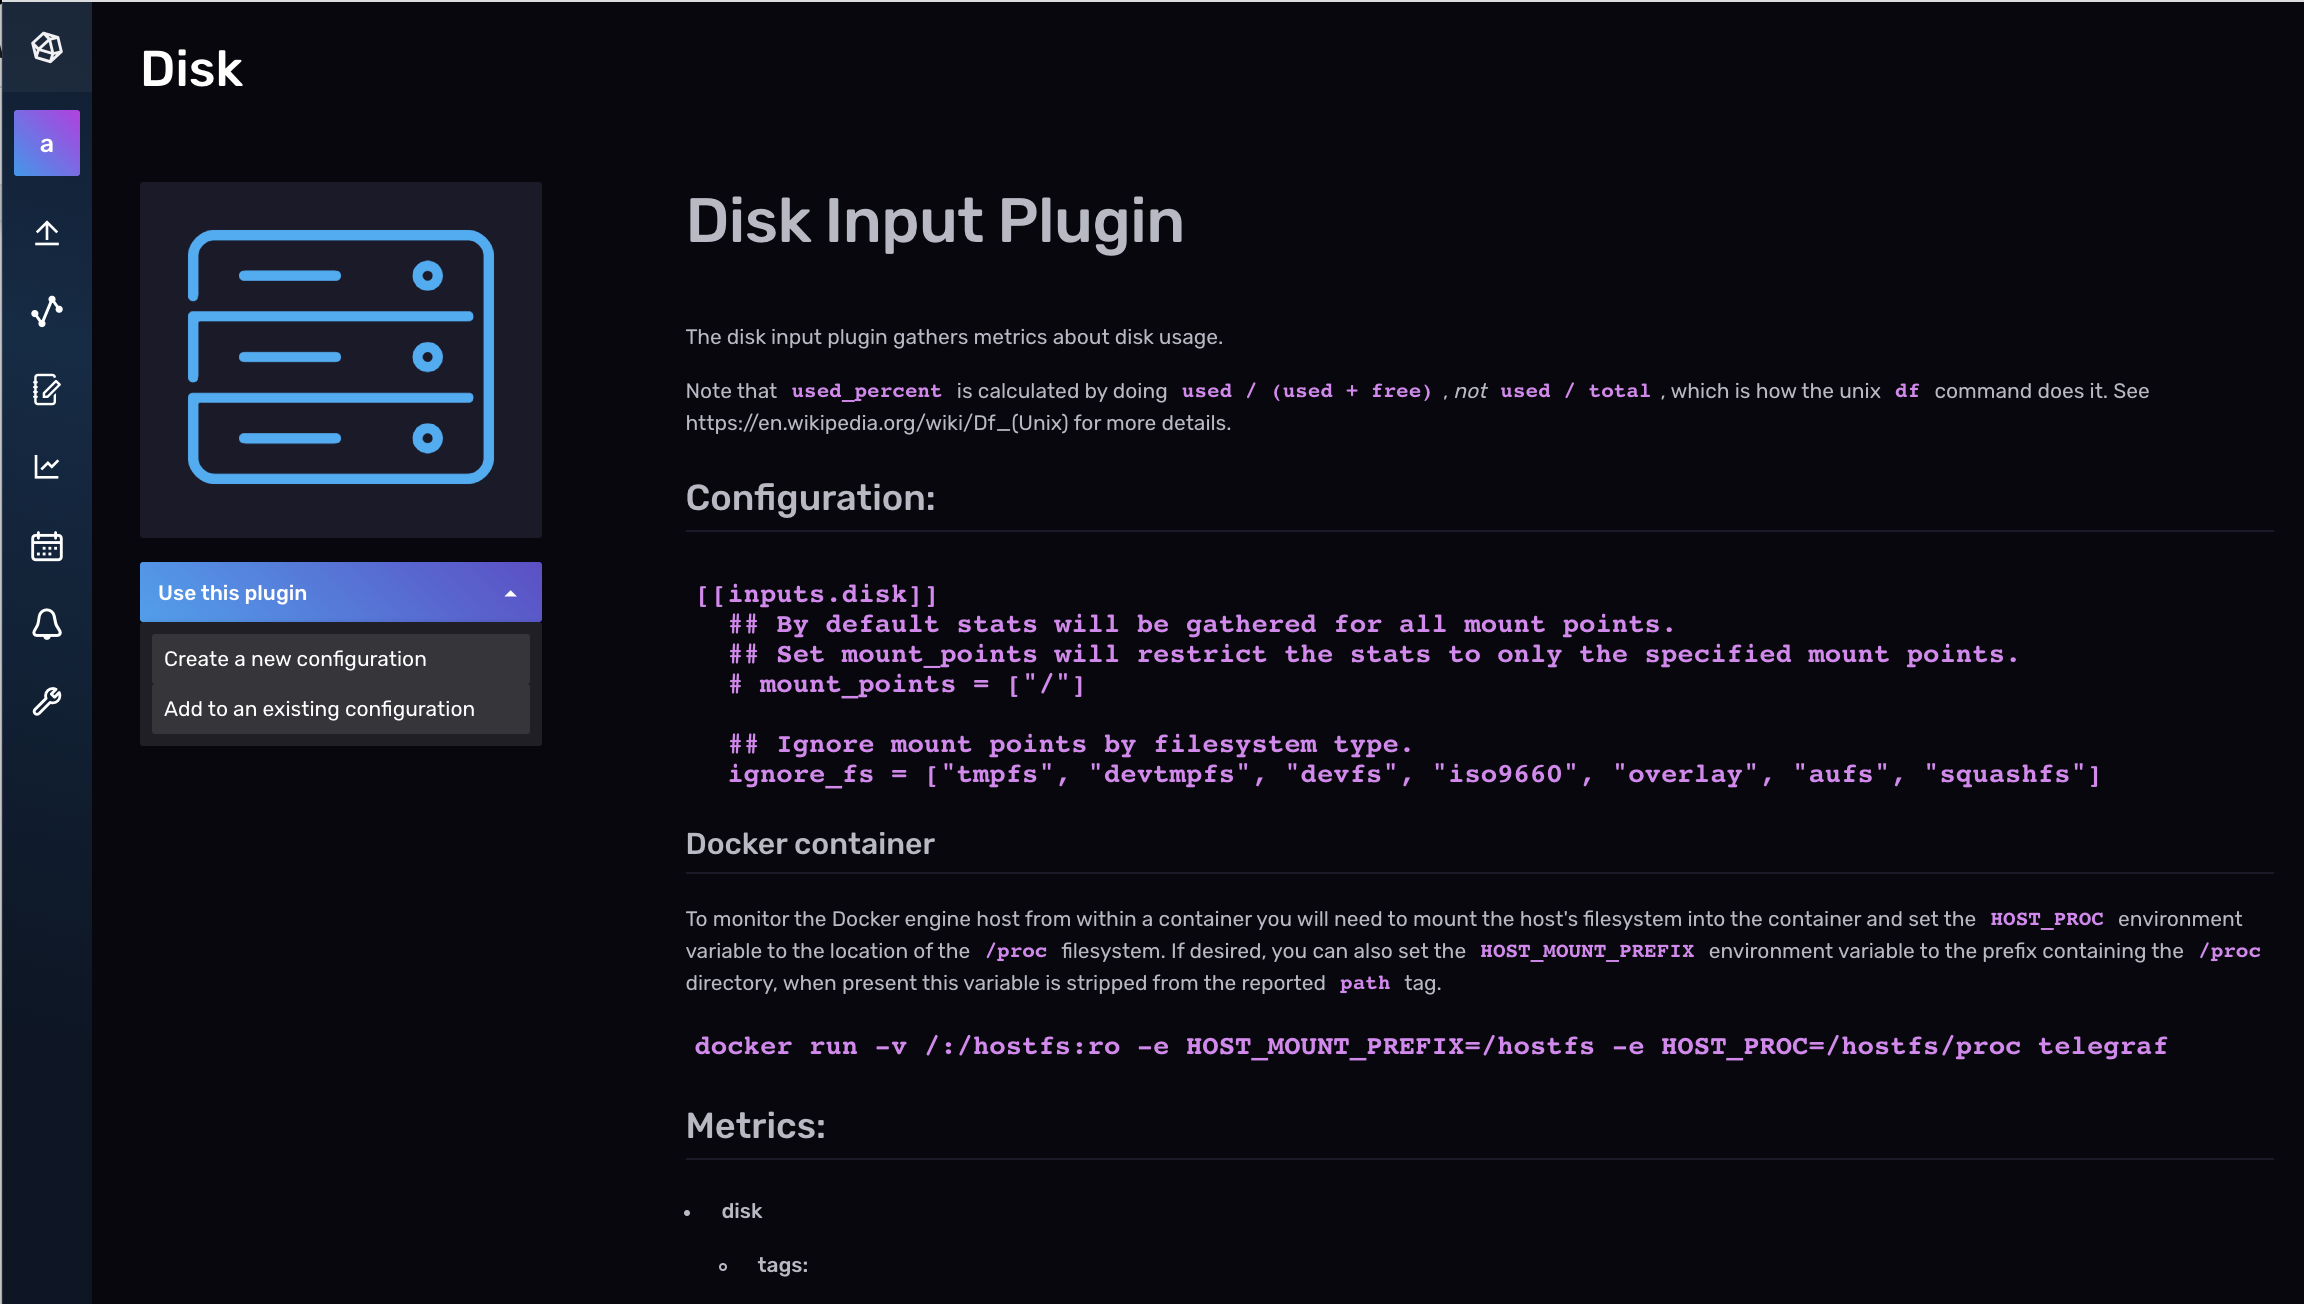
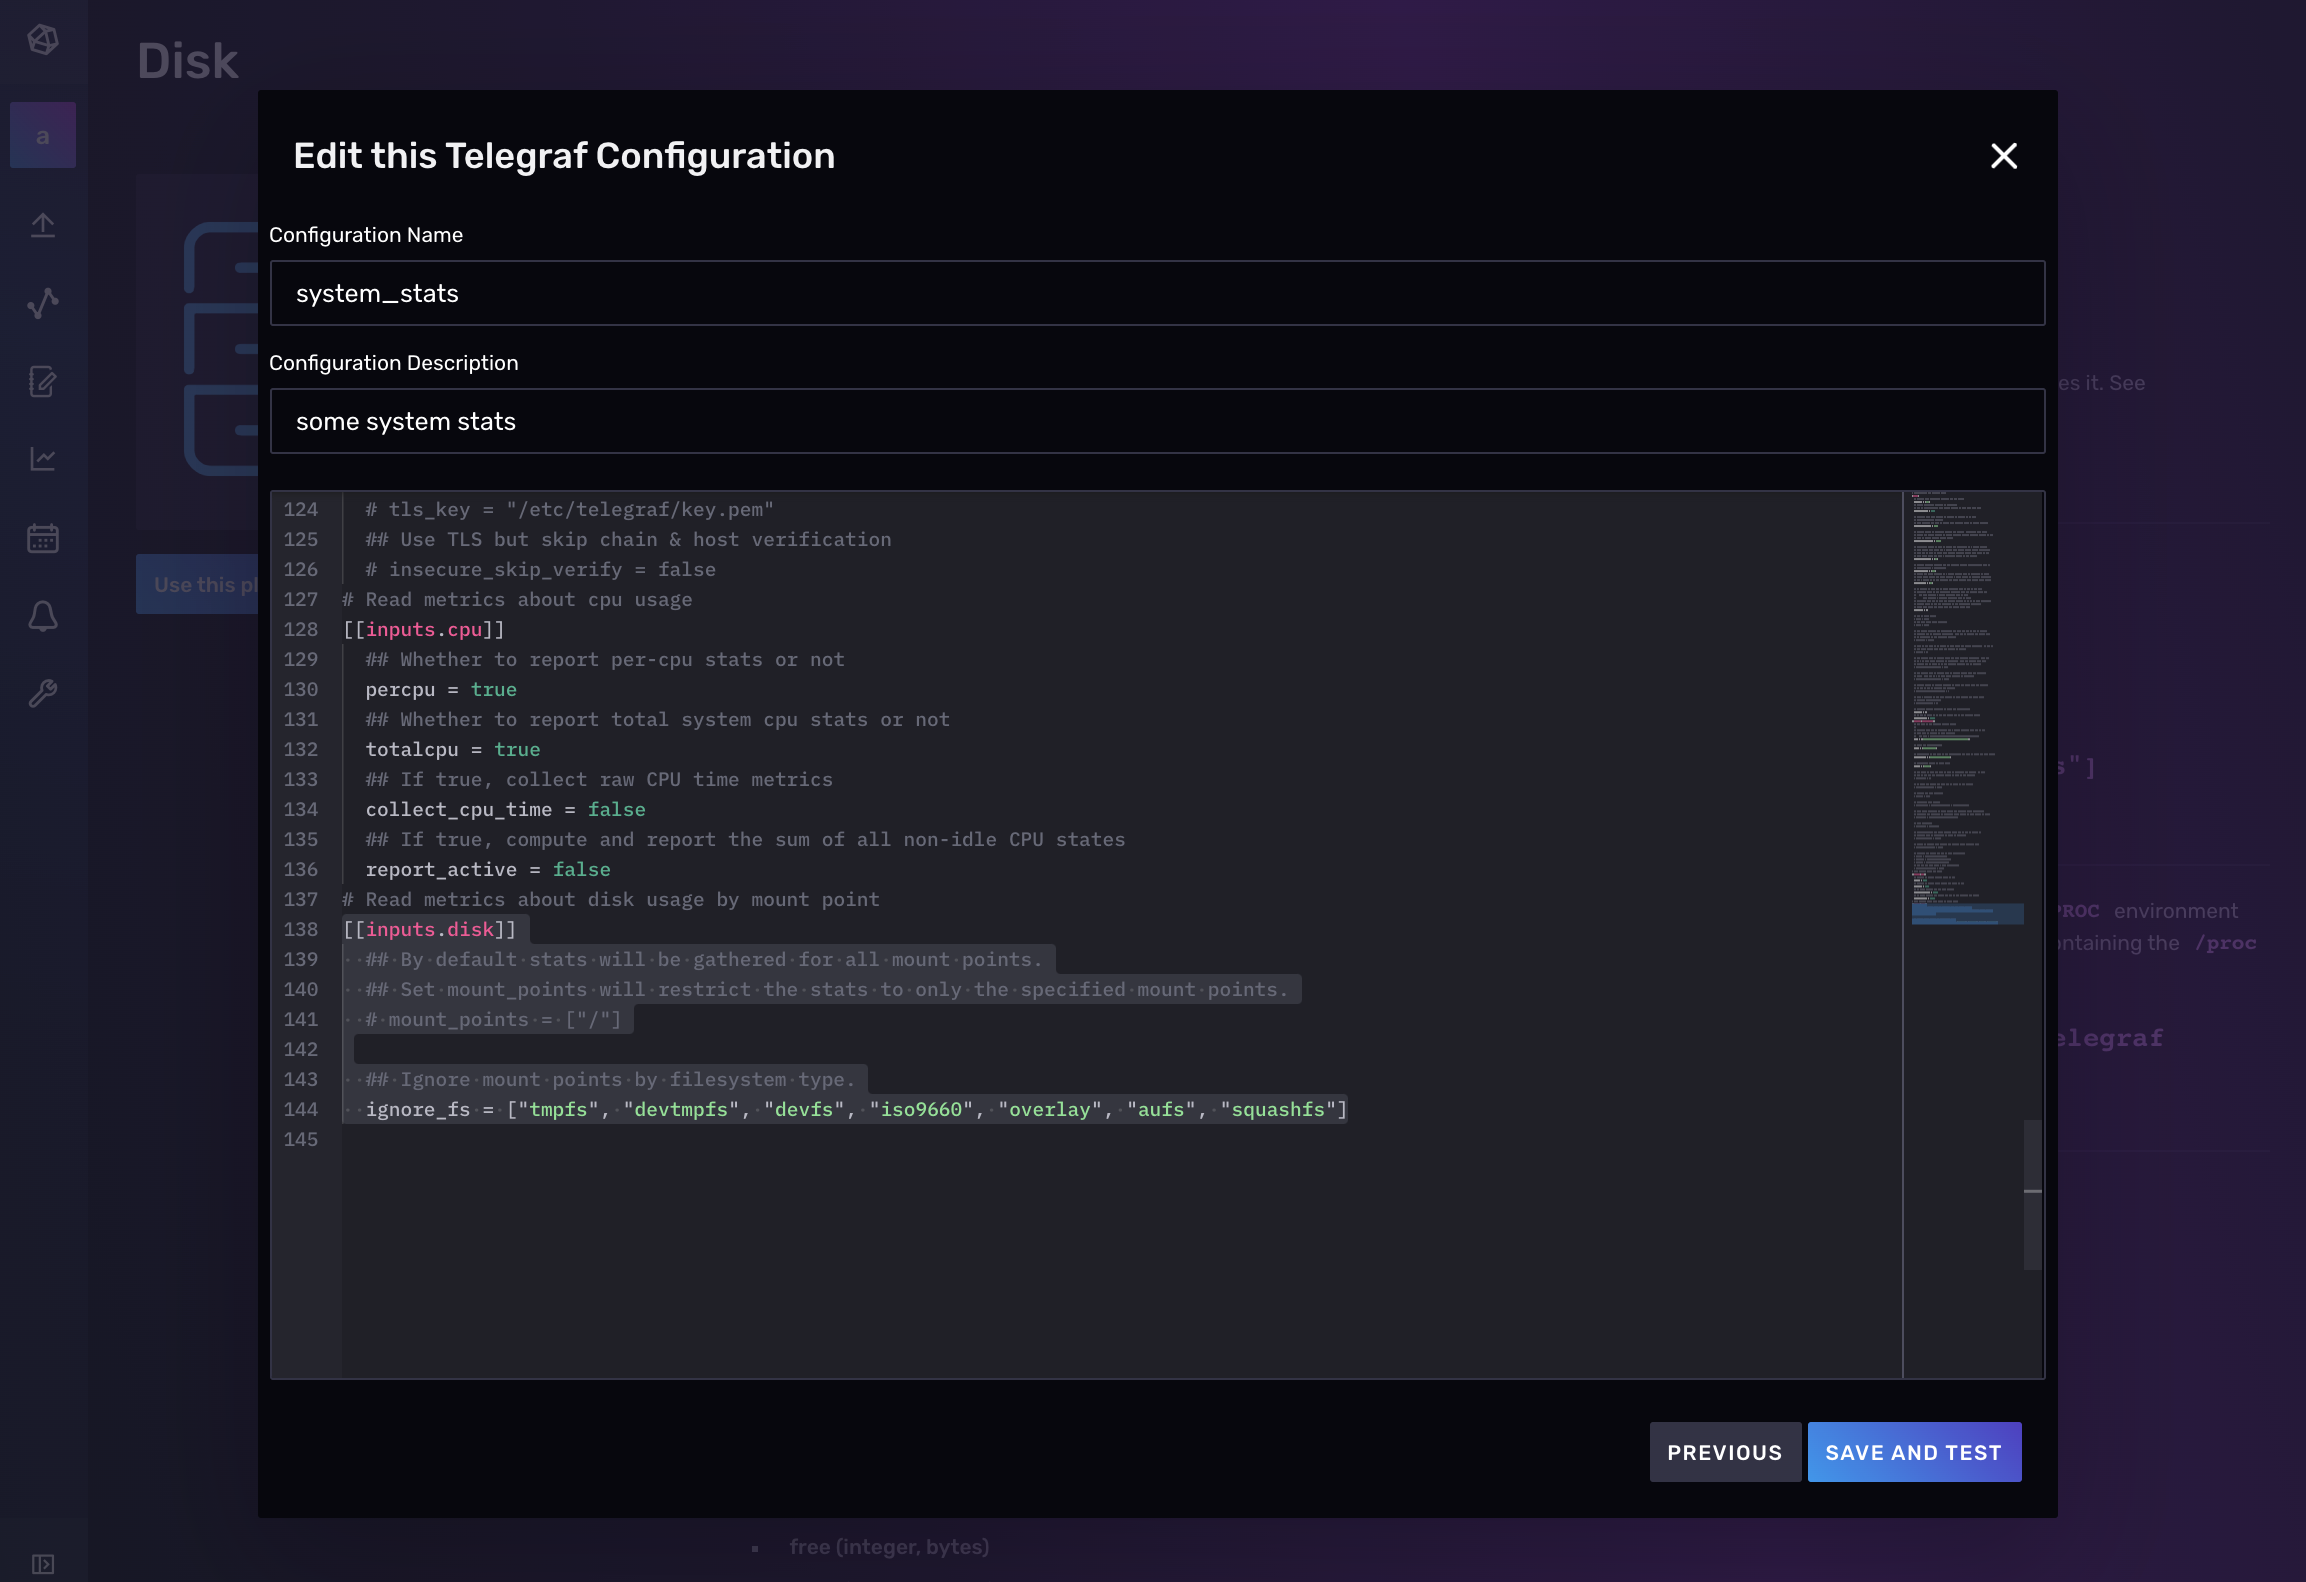
To add another plugin to an existing Telegraf configuration file, navigate to the Data tab and select the additional plugin you want to add under the list of Telegraf Plugins. In the screenshot below, we’re adding an additional Disk Input Plugin to their existing “system_stats” configuration which already contains one CPU Input Plugin. Next, select the dropdown to Add to an existing configuration.
Finally, select the existing Telegraf configuration that you want to add an additional plugin to and click Add to Existing Config. We’re adding a second Aerospike Input Plugin to an existing Telegraf config named “system_stats”.
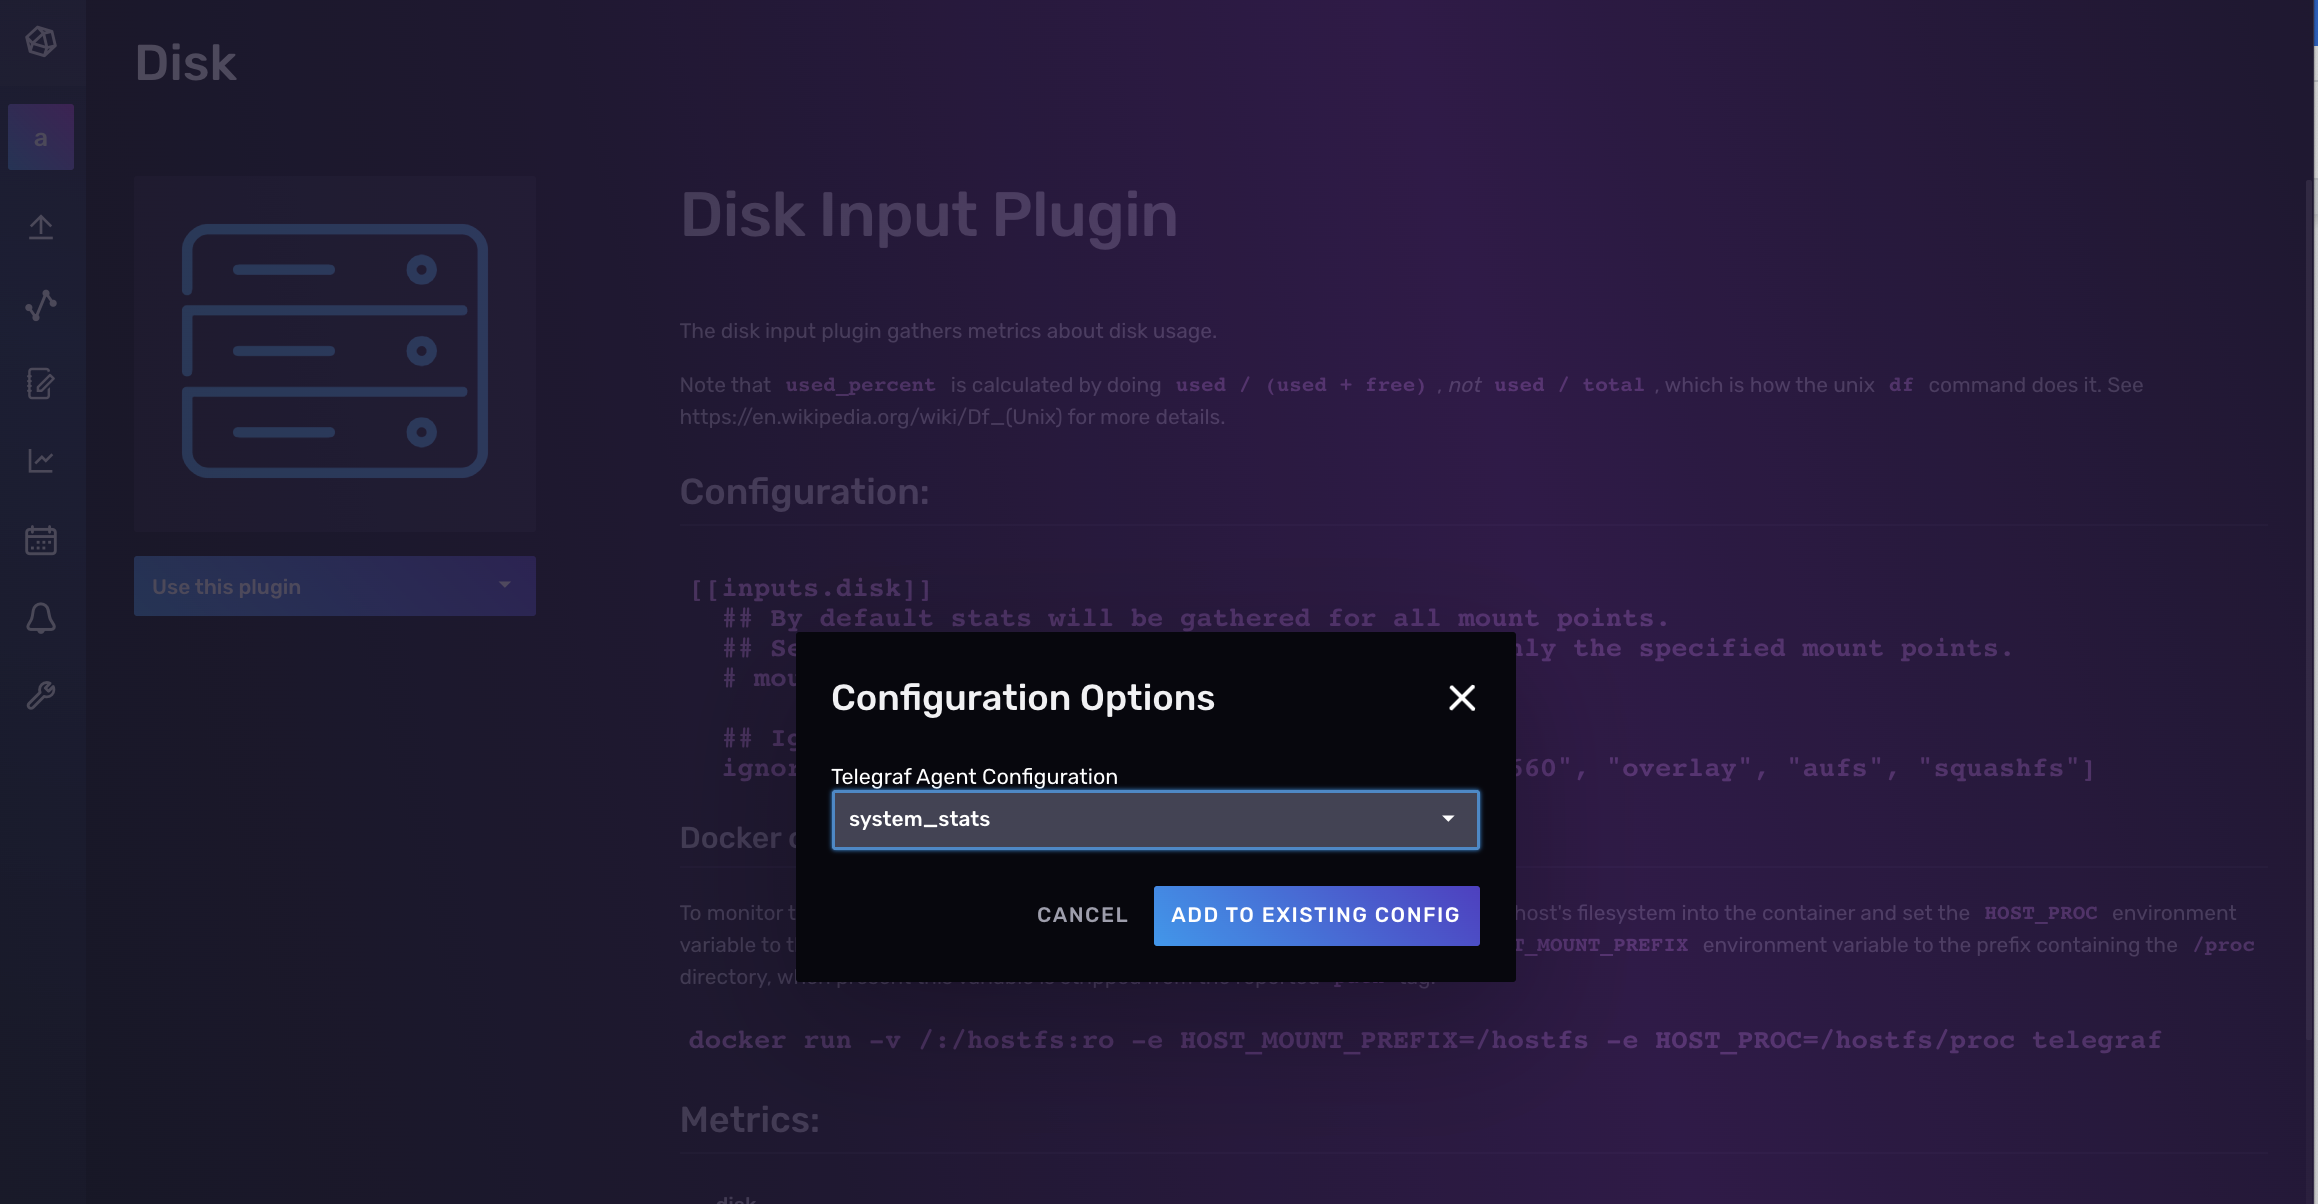
That’s all there is to it! Now you can verify that your Telegraf config contains the plugins you want and make any necessary edits to the configuration, name, and description before hitting Save and Test.
Through the command line
Of course you can also use the command line to create a Telegraf configuration. To generate a configuration, run the following command:
telegraf --section-filter agent:inputs:outputs --input-filter cpu --output-filter influxdb_v2 config > system_stats.conf
Use the --test flag to run a config and output the results to stdout. This is especially useful for debugging your Telegraf configuration. Pass in the location of your configuration to the --config flag.
telegraf --config $PWD/system_stats.conf --test
Finally to run Telegraf with your configuration use:
telegraf --config $PWD/system_stats.conf
Of course, if you’re working through the command line, then you’ll have to configure the plugin yourself. Open system_stats.conf in your favorite IDE, and then navigate to the individual plugins and configure the options. Telegraf also accepts environment variables in your configuration. In the output plugin below, we’ve replaced the configuration options with environment variables:
[[outputs.influxdb_v2]]
  urls = ["${INFLUX_HOST}"]

  ## Token for authentication.
  token = "${INFLUX_TOKEN}"

  ## Organization is the name of the organization you wish to write to; must exist.
  organization = "${ORG}"

  ## Destination bucket to write into.
  bucket = "${BUCKET}"
Agent configuration
To configure each input plugin and output plugin correctly, you’ll need to follow the documentation for your specific plugin. However, the agent configuration options remain the same for any combination of plugins you choose. I recommend looking through all of the options and familiarizing yourself with them to have the best control over your Telegraf instance. However, the default configurations are usually good for most users. The options that you’re mostly likely to want to change include:
- debug. This option allows you to run Telegraf in debug mode to receive detailed logs. The default is false, or unenabled. To enable debug mode set the debug option to true.
- interval. This option specifies how frequently data is being collected. You might need to change this value if you want to collect data at an interval other than the 10s default.
- flush_interval. This option specifies how frequently data is flushed for outputs. Do not set this below the interval value. This might change if you change the interval.
- metric_batch_size: This option lets you adjust the size of your metric batch. You might want to increase this for high-ingest workloads.
- metric_buffer_limit: This option lets you control the metrics caching buffer. You might want to increase this for high-ingest workloads or Telegraf instances running complex processing workloads.
Transforming Data
Part of what makes Telegraf so popular is that it’s much more than just a simple collection agent. Telegraf also allows you to process and transform your data before writing it to the data store of your choosing. In this section we’ll show how to use two of the most popular processor plugins:
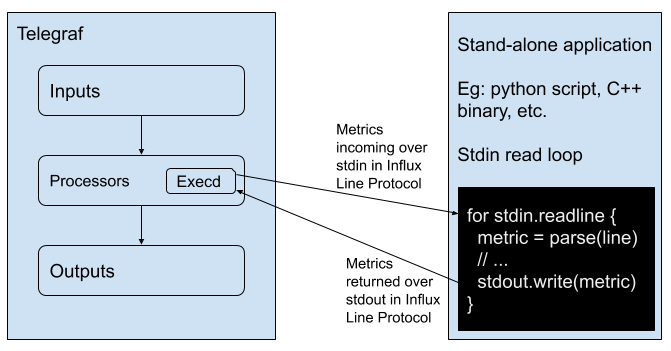
- execd processor plugin: This plugin runs an external program in the language of your choice as a separate process. It pipes metrics into the process’s STDIN and reads processed metrics from STDOUT. Like with all of the execd plugins, the execd processor plugin makes telegraf extensible in any language.
- Starlark processor plugin: This plugin “calls a Starlark function for each matched metric, allowing for custom programmatic metric processing”, as per the documentation. Starlark is a Python dialect intended for configuration.
Transforming Data with Starlark
You can apply all sorts of transformations with the Starlark processor plugin including:
- Dropping string fields
- Processing JSON
- Parse timestamps
- Use math to calculate a new field
- and so much more. I encourage you to take a look at all of the examples in the test data folder in the Starlark processor plugin repository.
In this section we’ll perform a unit conversion. Assume we already have the cpu input plugin and the influxdb_v2 output plugin configured in our telegraf config. The cpu plugin generates the following data:
- 1 measurement: cpu
- 1 tag: cpu
- N+1 tag values: where N = the number of CPU’s on your machine and also the cpu-total
- 10 fields:
- usage_guest
- usage_guest_nice
- usage_idle
- usage_iowait
- usage_irq
- usage_nice
- usage_softrirq
- usate_steal
- usage_system
- usage_user
The field values are measured in GHz. We can use the Starlark processor plugin to convert from GHz to MHz, for example.
[[processors.starlark]]
source = '''
# Convert GHz to MHz
def apply(metric):
# k stands for key, v for value
for k, v in metric.fields.items():
if type(v) == "float":
# 1000 MHz in a GHz
metric.fields[k] = v * 1000
return metric'''
Create a function to apply to each field. Iterate over the field key and field values and use the items() method to modify the fields attribute. Finally return the modified metrics with updated field values.
Transforming JSON
While you can use the file input plugin with JSON format or JSON v2 format to parse JSON with Telegraf, you can also use the Starlark processor plugin to parse it as well. Let’s borrow an example of how to parse JSON with the Starlark processor plugin from the test data folder. If we have the following JSON, input.json:
{"label":"hero","count": 14}
We use the file plugin to read the json file and convert the json into a value in line protocol:
[[inputs.file]]
 files = ["input.json"]
 data_format = "value"
 data_type = "string"
The value data format translates single values into line protocol. We specify the data type as a string to encapsulate our json in a string. Our resulting line protocol is:
file,host=host1 value="{\"label\": \"hero\", \"count\": 14}" 1637344008000000000
Now we can parse the json value from the line protocol with the following Starlark function in the Starlark processor configuration:
[[processors.starlark]]
source = '''
load("json.star","json")
def apply(metric):
j = json.decode(metric.fields.get('value'))
metric = Metric("stats")
metric.tags["label"] = j["label"]
metric.fields["count"] = j["count"]
return metric
'''
First load the json with the load() function and specify the path to the json and the file type. Next create a function to apply to each json from the file. Use the decode() method to decode the JSON string from the field value that contains it. We use the Metric() function to assign a measurement name.f The resulting line protocol looks like:
stats,label=hero count=14i 1637344008000000000
Notice how the measurement name and the other tags are dropped from the line protocol output form the input plugin.
Add Functionality with Execd Processor Plugin
All of the execd plugins run external programs as a long-running daemon in the language of your choice. In this way the execd plugins allow you to add any functionality you want to Telegraf. If you can’t find the functionality you’re looking for already within the existing Telegraf plugins, check out the following execd plugins:
I also encourage you to browse the external plugins. External plugins are community contributed plugins that utilize execd plugins for a variety of data collection, processing, and writing purposes.
In this section we’ll highlight a trivial example of how to use the execd processor plugin with Python, so that you can understand how to expand the example to fit your needs. The Execd processor plugin runs an external program as a separate process and pipes metrics to the process’s STDIN and reads processed metrics from its STDOUT. The programs must accept line protocol on standard in (STDIN) and output metrics in line protocol to standard output (STDOUT).
The following script is a simple example of using the Execd processor plugin to read STDIN and print the metrics to STDOUT with Python, trivial_example.py.
# A simple processor. It reads stdin and writes it to stdout.
import sys

def main():
   for line in sys.stdin:
       print(line.rstrip())
       sys.stdout.flush()

if __name__ == '__main__':
   main()
The Python script simply strips the lines of data from the text file and writes them to stdout. Then these lines are written to InfluxDB. Where the following telegraf config is using the file input plugin to collect and write line protocol data from line_protocol.txt:
[[inputs.file]]
  files = ["line_protocol.txt"]
  data_format = "influx"

[[processors.execd]]
  command = ["python", "./processors/trivial_example.py"]

[[outputs.influxdb_v2]]
  urls = ["${INFLUX_HOST}"]
  token = "${INFLUX_TOKEN}"
  organization = "${ORG}"
  bucket = "${BUCKET}"
Running an external program to merely write metrics to STDOUT is not useful, but hopefully now you have an understanding of how you can use the execd plugins to make telegraf extensible in any language. Instead of running an external Python program that writes metrics to STDOUT, your processor plugin can:
- Convert other data formats to line protocol
- Apply sophisticated transformations
- Or anything you want to write a script for.
Compiling Telegraf
The wide selection of Telegraf plugins offer a ton of flexibility and power when it comes to collecting, transforming, and writing data. However that power comes at a slight cost–size. If you want to run Telegraf at the edge, it’s a good idea to compile telegraf with just the plugin that you need to make the Telegraf binary smaller.
Telegraf requires Go version 1.17 or newer, the Makefile requires GNU make.
- Install Go >=1.17 (1.17.2 recommended)
- Clone the Telegraf repository:
git clone [https://github.com/influxdata/telegraf.git](https://github.com/influxdata/telegraf.git) - Identify the plugins you need, then comment out the ones you don’t need in the following files:
- ./plugins/inputs/all/all.go
- ./plugins/aggregators/all/all.go
- ./plugins/processors/all/all.go
- ./plugins/outputs/all/all.go
- Then run
make telegrafto build the binary.
Further Reading
- JSON to InfluxDB with Telegraf and Starlark
- MQTT Topic and Payload Parsing with Telegraf
- TL;DR InfluxDB Tech Tips — Time Series Forecasting with Telegraf
- Telegraf Best Practices: Config Recommendations and Performance Monitoring
- How to Parse JSON with Telegraf into InfluxDB Cloud
- How to Parse Your XML Data with Telegraf
- TL;DR InfluxDB Tech Tips – Creating a Telegraf Configuration with the InfluxDB UI