Tasks
Table of contents
- A Downsampling Task
- An Alert Task
- Writing Data from OSS to Cloud with a Task
- Understanding the _task bucket
- Debug and manage a Task with the UI
- Debug and manage a Task with the InfluxDB API v2
- Debug and manage a Task with the CLI
- Further Reading
Tasks are Flux scripts that run a user-defined schedule. Tasks are used for a wide variety of functions, including:
- Downsampling high resolution data into lower resolution aggragates
- Applying other data transformations to your data
- Sending notifications to a notification endpoint
- Writing data from OSS to Cloud
- Continuously writing with the http.get() function
Because tasks are primarily used to transform data that is being continuously written, for this section we’ll assume that you’ve configured the CPU input plugin as described in the telegraf section above.
A Downsampling Task
One of the most common types of a task is a downsampling task. A downsampling task is used to convert high resolution data into lower resolution aggregates. Downsampling tasks are a critical part of effective time series database management because they allow you to:
- Minimize your overall disk usage by only retaining high resolution data for short periods of time
- Enable you capture trends of your historical data
A task is a Flux script that is executed on a schedule. You can perform a lot of other functions with a task. You can either use the InfluxDB UI, InfluxDB v2 API, or CLI, or VS Code to create a task to perform this downsampling on a schedule.
Create a downsampling task in the InfluxDB UI
There are two ways to create a downsampling task in the InfluxDB UI:
- From the Data Explorer
- From the Tasks page
In this section we’ll cover the first method, as I believe it offers the most natural workflow. Use the Data Explorer to experiment with different materialized views of your data.
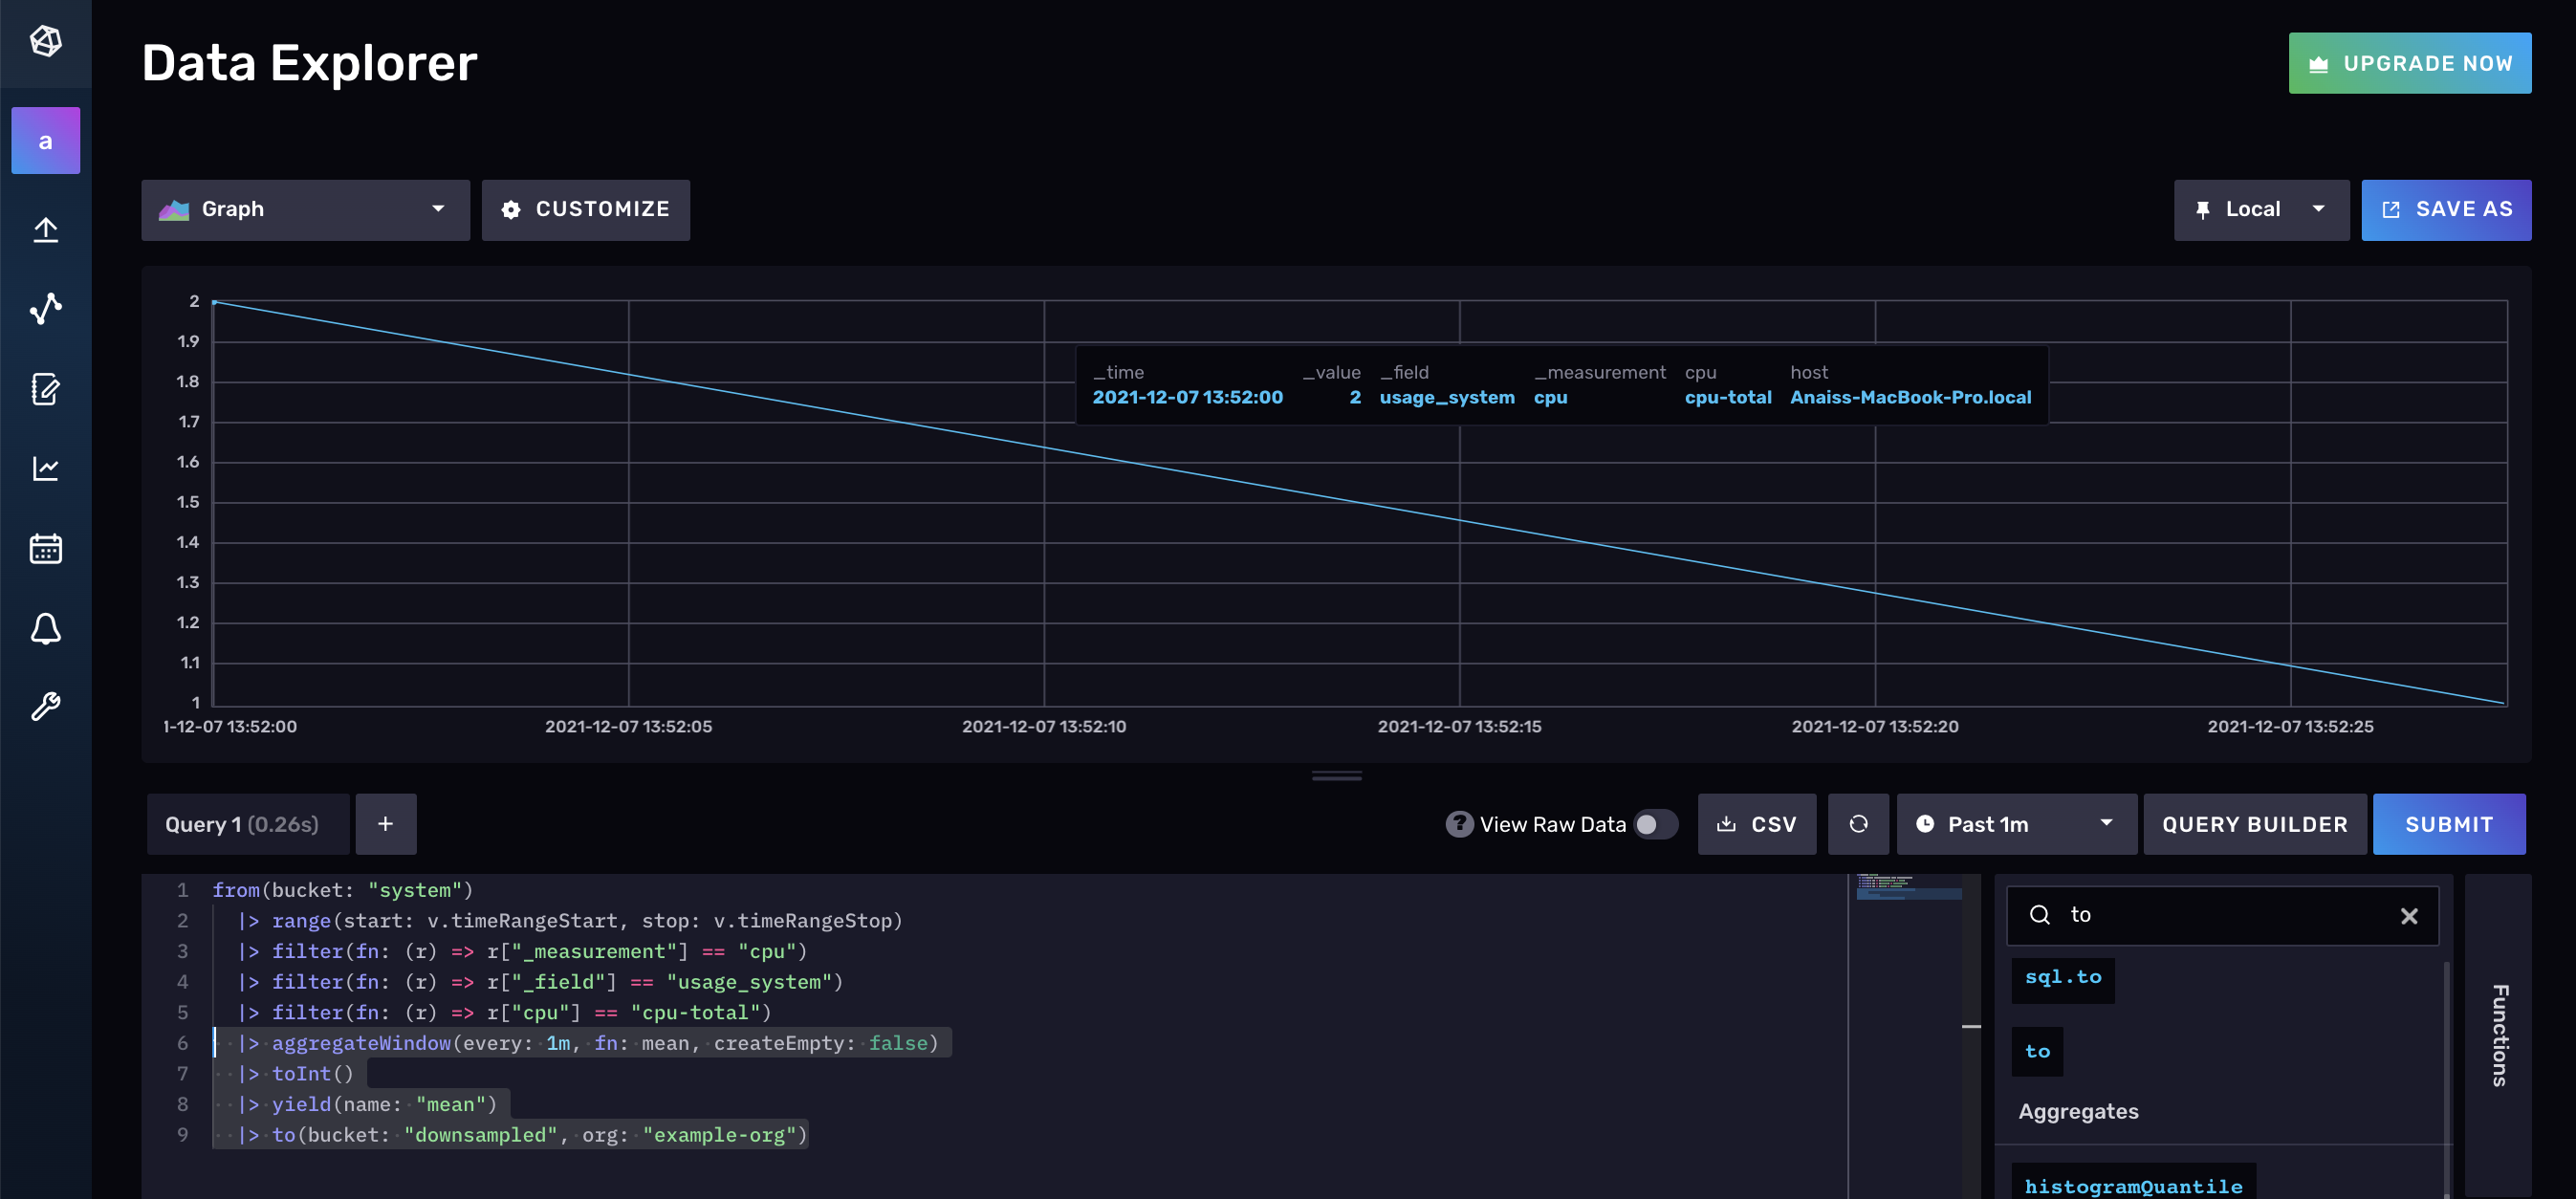
In the screenshot above we’re querying CPU data, and applying the aggregateWindow() function to calculate the mean every minute. We’re also transforming the data with the toInt() function.
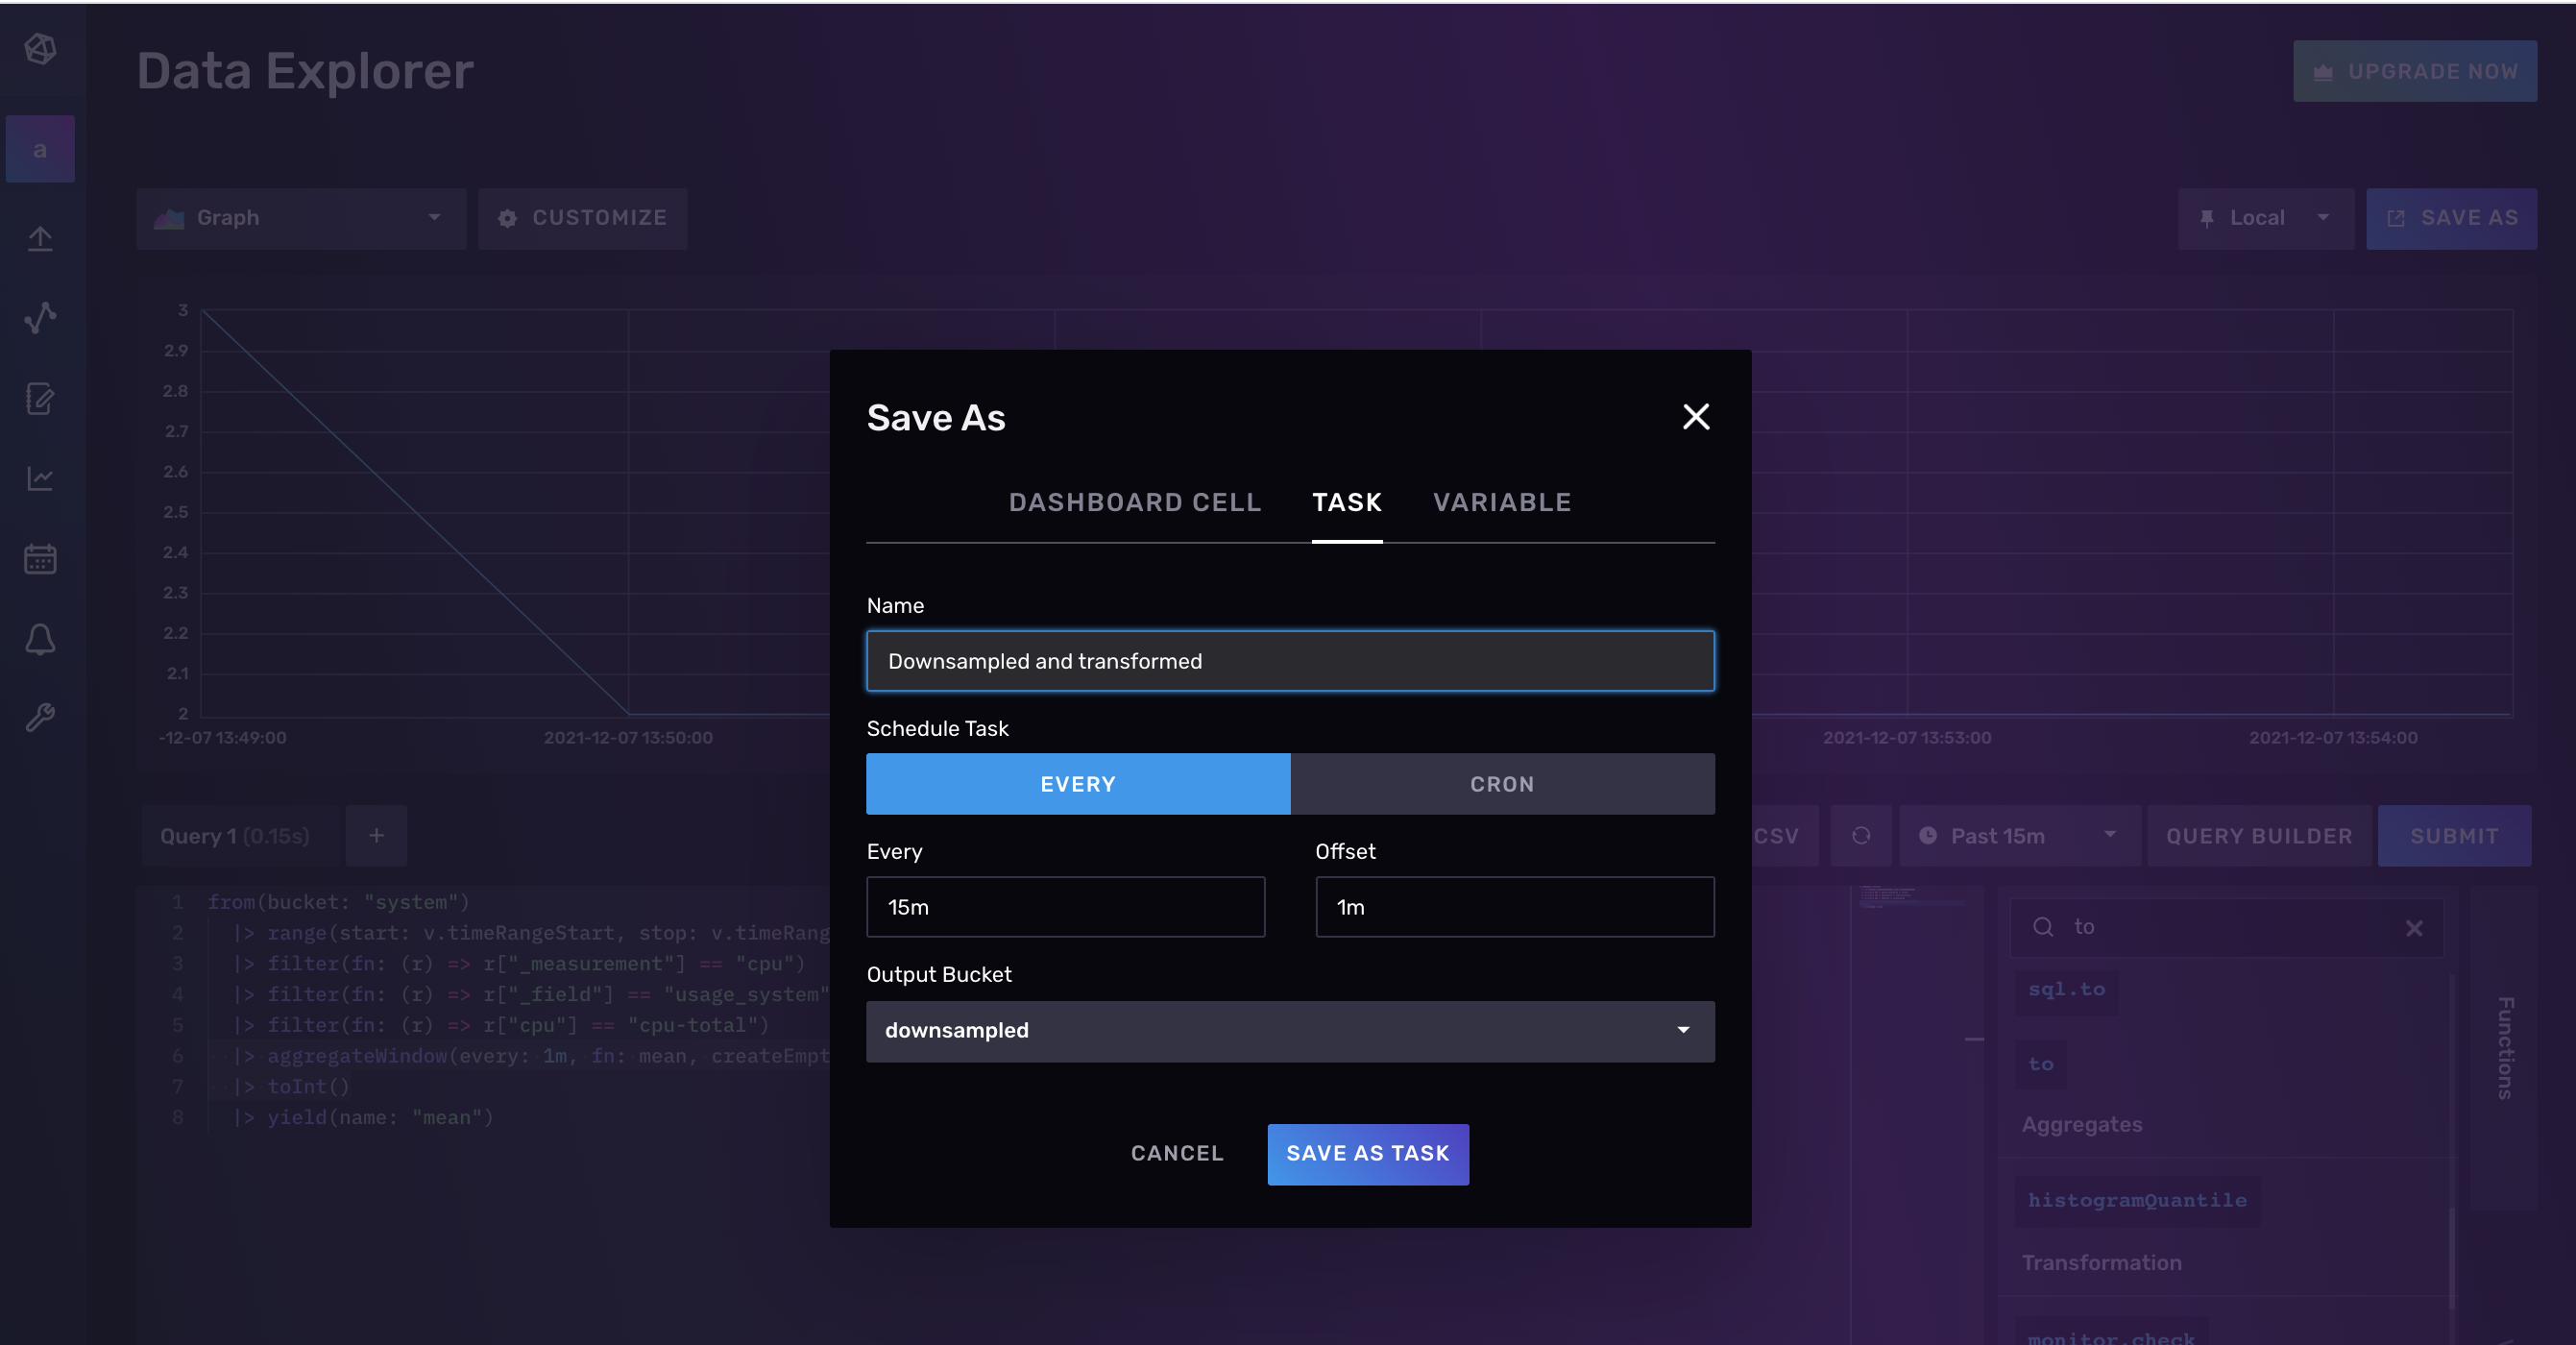
Once you are satisfied with the aggregation or flux transformation that you want to apply, select the Save button. Save the query as a task by selecting the Task tab in the Save As **window. Name your task and specify the **Every option of your task. This will specify how frequently you want to run your task. Also include an Offset to avoid any read and write conflict. The offset configuration option delays the execution of the task but queries the data based on every option. Take a look at the docs for a full list of task configuration options.
Create a downsampling task with the InfluxDB v2 API
To create a downsampling task with the InfluxDB v2 API you must submit a POST request to the /api/v2/tasks endpoint. Include your token, orgID, the Flux for your task, and the status of your task. An active task will execute on the task every interval. Since the body of the request is JSON, make sure to escape any double quotes in your Flux.
curl --location --request POST \
'https://us-west-2-1.aws.cloud2.influxdata.com/api/v2/tasks' \
--header 'Authorization: Token XXX==' \
--header 'Content-Type: application/json' \
 --data-raw '{"orgID": "0437f6d51b579000",
 "status": "inactive",
 "flux": "option task = {name: \"Downsampling and transformation\", every: 15m, offset: 1m}\n from(bucket: \"system\")\n |> range(start: -task.every)\n |> filter(fn: (r) => r[\"_measurement\"] == \"cpu\")\n |> filter(fn: (r) => r[\"_field\"] == \"usage_user\")\n |> filter(fn: (r) => r[\"cpu\"] == \"cpu-total\")\n |> aggregateWindow(every: 1m, fn: mean, createEmpty: false)\n |> to(bucket: \"downsample\")\n",
 "description": "downsamples total cpu usage_user data into 1m averages every 15m"
}'
If your request is successful it will yield the following result:
 {"links":{"labels":"/api/v2/tasks/0891b50164bf6000/labels",
           "logs":"/api/v2/tasks/0891b50164bf6000/logs",
           "members":"/api/v2/tasks/0891b50164bf6000/members",
           "owners":"/api/v2/tasks/0891b50164bf6000/owners",
           "runs":"/api/v2/tasks/0891b50164bf6000/runs","self":"/api/v2/tasks/0891b50164bf6000"},
           "labels":[],
           "id":"0891b50164bf6000",
           "orgID":"XXX",
           "org":"anais@influxdata.com",
           "ownerID":"XXX",
           "name":"mytask",
           "description":"downsamples total cpu usage_user data into 5m averages every 10m",
           "status":"active",
           "flux":"option task = {name: \"mytask\", every: 10m, offset: 1m}\n from(bucket: \"system\")\n |\u003e range(start: -task.every)\n |\u003e filter(fn: (r) =\u003e r[\"_measurement\"] == \"cpu\")\n |\u003e filter(fn: (r) =\u003e r[\"_field\"] == \"usage_user\")\n |\u003e filter(fn: (r) =\u003e r[\"cpu\"] == \"cpu-total\")\n |\u003e aggregateWindow(every: 5m, fn: mean, createEmpty: false)\n |\u003e to(bucket: \"downsampled\")\n",
           "every":"10m",
           "offset":"1m",
           "latestCompleted":"2021-12-07T22:10:00Z",
           "lastRunStatus":"success",
           "createdAt":"2021-12-07T21:39:48Z",
           "updatedAt":"2021-12-07T22:20:16Z"}
Notice that the result runs the task ID. This will be useful for debugging tasks later.
Create a downsampling task with the CLI
To create a task with the CLI use the influx task create command and supply the location of your Flux script.
influx task create --file /path/to/example-task.flux
An Alert Task
In the next section, we’ll learn all about InfluxDB’s Checks and Notification system which allows you to craft custom alerts on your time series data. However, you don’t have to use the Checks and Notification system to send an alert. Instead, you can elect to bypass the system entirely if you want and send alerts with a task. This isn’t a recommended approach. Using a task to entirely bypass the Checks and Notification system results in the following disadvantages:
- No visibility or metadata about your alert
- A lack of a structured alerting pipeline
However understanding this type of task is helpful for understanding the Checks and Notification system. Additionally, this approach could suffice for hobbyists who aren’t relying on visibility into their alerts.
For this example let’s imagine that we want to create an alert based off of the number of events that occurred within a specified period. If the number of events exceeds a threshold value, then we want to get a notification to Slack. For this task, imagine that we are pushing data to InfluxDB when something happens. In other words, we are writing event data instead of metrics.
Import packages and configure task options
The first step is to import the necessary packages and configure the task options, as usual.
import "array"
import "slack"

option task = { name: "Event Alert", every: 1h0m0s, offset: 5m0s }
Configure the Slack Endpoint
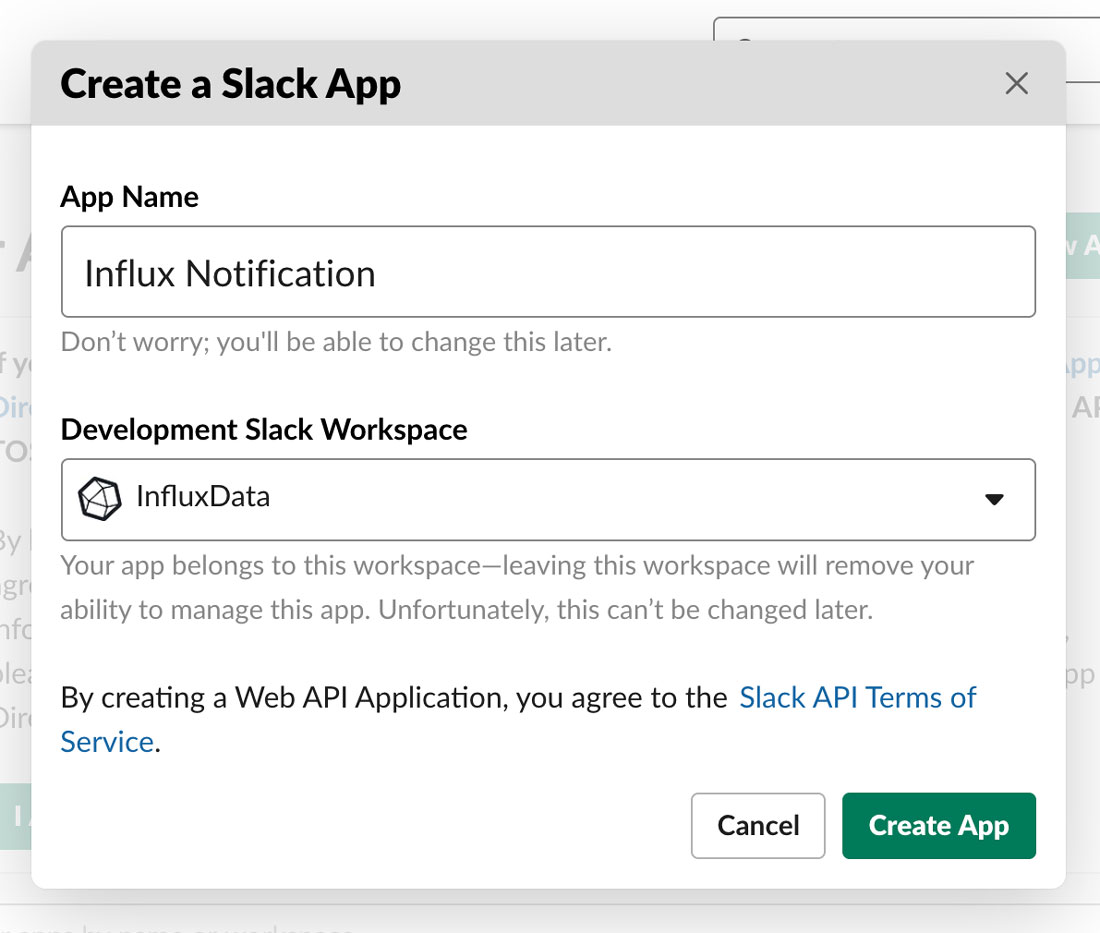
We’ll use the slack.message() function to write a notification to our slack endpoint. To find your Slack Incoming Webhook URL, visit https://api.slack.com/apps. Then Create a New App.

Specify the App Name you want to give your app and the Development Slack Workspace that you want to use.
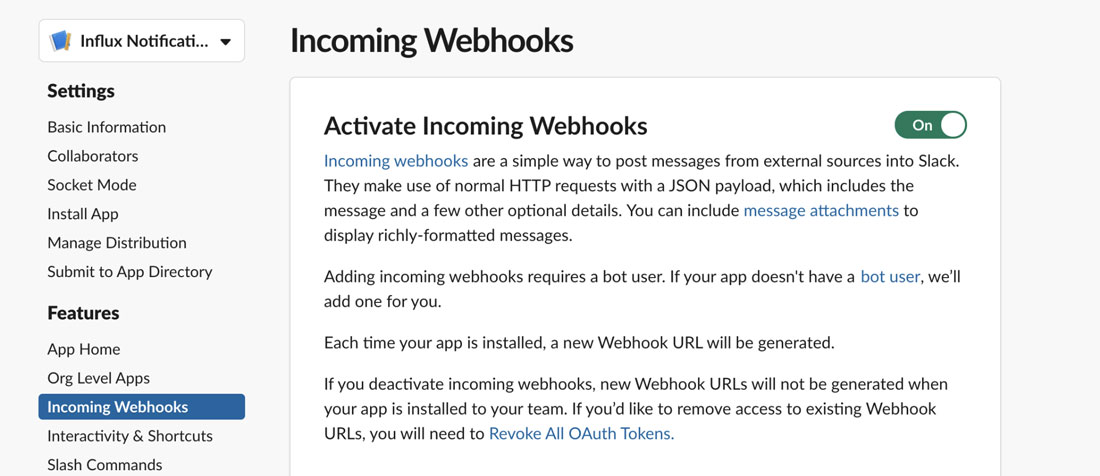
Next, Activate Incoming Webhooks with the toggle on the Incoming Webhooks page.
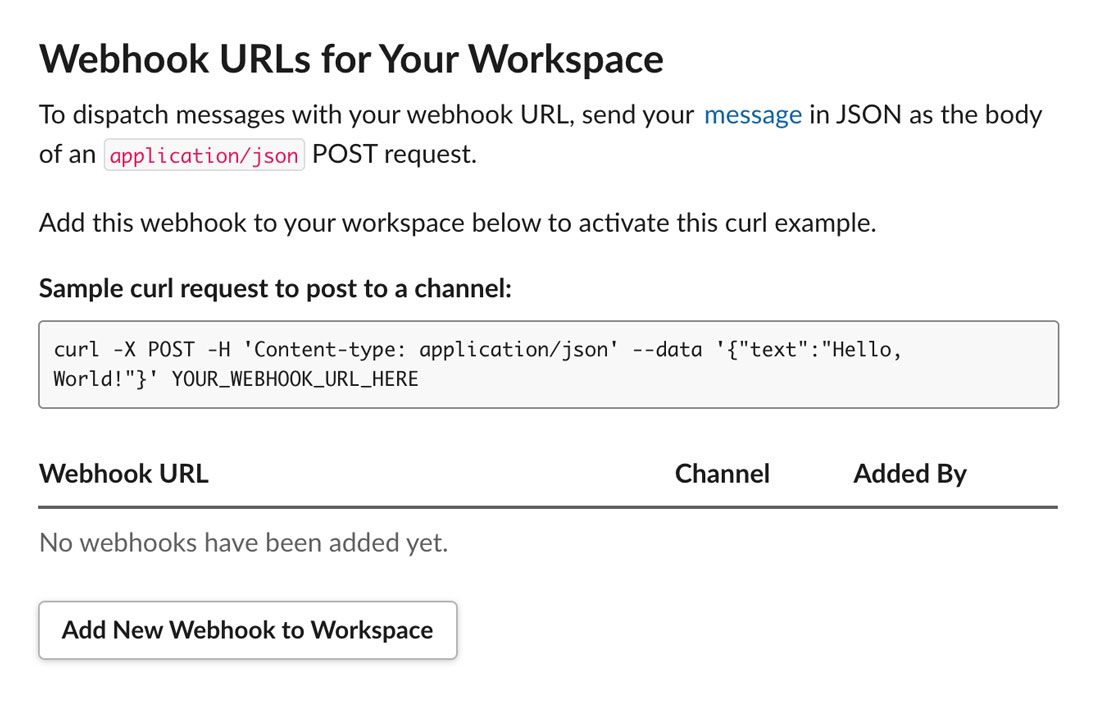
Now you are ready to Add a New Webhook to Workspace.
At this point, Slack will request permission to access your Slack workspace and require you to select a channel to post to.
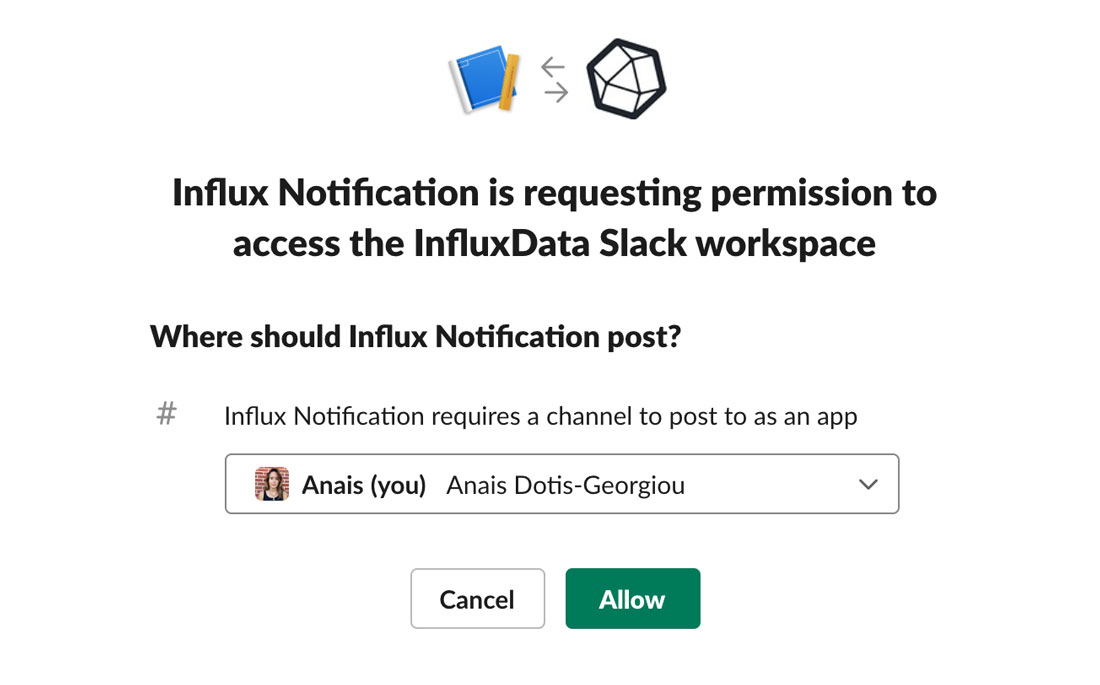
Now, you should be able to see this permission access and Webhook integration reflected in your Slack channel.

Finally, you generated a Webhook URL for your workspace. You’ll use this URL when using the slack.message() function (or later when creating a Notification Endpoint through the InfluxDB UI covered in the Checks and Notifications section) to receive notifications.
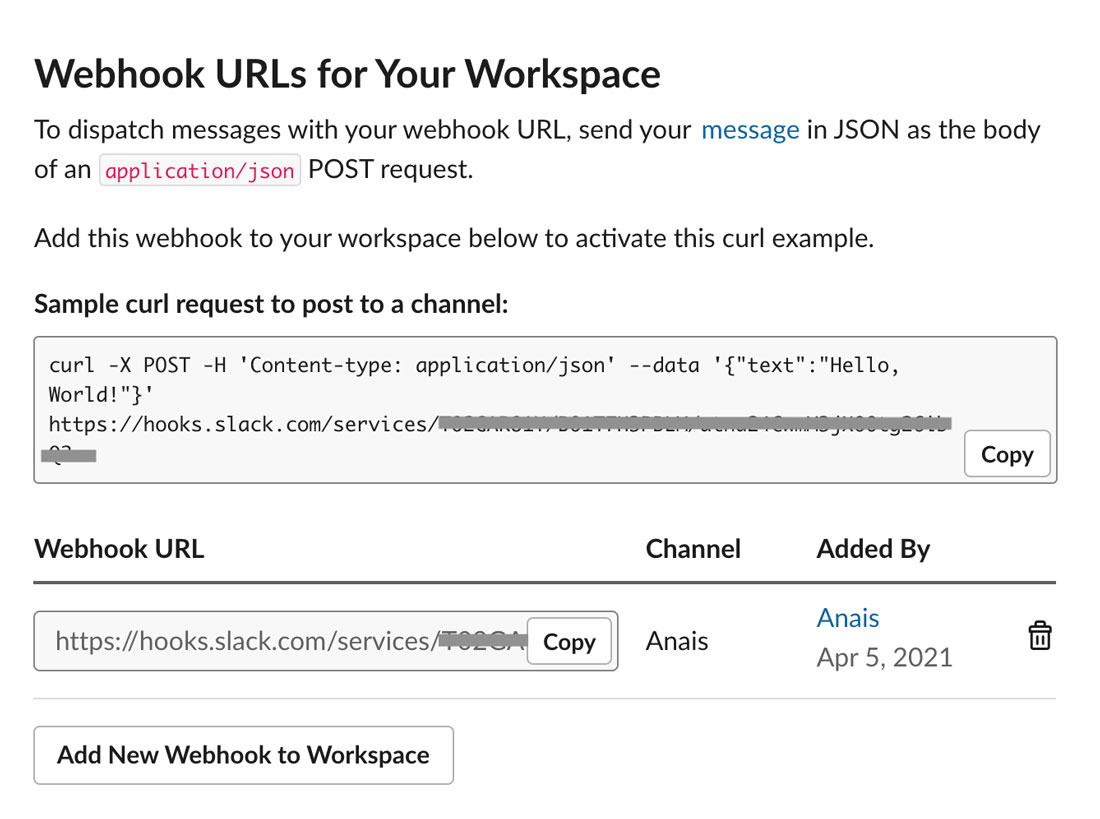
Now that you have our Slack webhook URL for your workspace we’re ready to use the slack.message() function in our Flux task to send alerts to our slack workspace. The slack.message() function requires 4 parameters:
url: This is either the Slack API URL or the Slack Webhook, the URL we gathered in the section above.channel: The slack channel you want to post the message to. If you just want to send a notification to yourself, you don’t need to provide any value.token: The Slack API token that’s required if you’re using the Slack API URL. Since we’re using the Slack Webhook, you don’t need to provide any value.text: The message you want to send to your slack. We can include any floats, integers, or timestamps in our message by interpolating the values and returning them as strings with${}notation.
For example if we wanted to test our Slack webhook, use the following Flux:
import "slack"
numericalValue = 42

slack.message(
  url: "https://hooks.slack.com/services/####/####/####",
  text: "This is a message from the Flux slack.message() function the value is ${numericalValue}.",
)
Create a custom function to handle conditional query logic
Next, we’ll create a custom function to send a slack message if the number of events exceeds our threshold. We must create a custom function to encapsulate the conditional query logic because you cannot include conditional logic outside of a function with Flux.
alert = (eventValue, threshold) =>
   (if eventValue >= threshold then slack.message(
       url: "https://hooks.slack.com/services/####/####/####",
       text: "An alert event has occurred! The number of field values= \"${string(v: eventValue)}\".",
       color: "warning",
   ) else 0)
Our custom function is called alert. It takes two parameters:
eventValue:the number of events that happened in the last hour as configured by the task.every option.threshold: the our threshold value of the number of acceptable events within the last hour.
We use conditional logic to specify that if the number of events exceeds the threshold then we should call the slack.message() function and send a notification message to Slack. Then we call the slack.message() function and pass in our Webhook URL and our notification message into the url and text parameters, respectively. We interpolate the eventValue parameter of our custom function and include it in the message.
Querying our data
Finally we must query our data to calculate the number of events that happened from the last time the task ran. We store the results in the variable, data. We filter our data and use the sum() function to find the total number of events within the task.every duration.
data = from(bucket: "bucket1")
   |> range(start: -task.every, stop: now())
   |> filter(fn: (r) =>
       (r._measurement == "measurement1" and r._field == "field1" and exists r._value))
   |> sum()
We must also construct a dummy table, data_0, to handle the instance where no events have occurred in the last hour, so that we can successfully pass a value into our custom alert() function. We use the array.from() function to construct the table with a single _value column and a single value of 0.
data_0 = array.from(rows: [{_value: 0}])
Next we union the two tables together, group them together, and sum the values of the two tables together. Since the value of the data_0 table is 0 the value of the _value column of the events table will be either:
- 0 when no events have occurred or when our
datatable returns no results - 0 + n when n events have occurred or when our
datatable return results
We use the findRecord() function to extract the number of events from the _value column. We must yield our dummy table because Flux tasks have a requirement: you must invoke streaming data. If you would like the Flux team to prioritize lifting this requirement please comment on this issue #3726.
events = union(tables: [data_0, data])
   |> group()
   |> sum()
   |> findRecord(fn: (key) =>
       (true), idx: 0)
eventTotal = events._value

data_0
   |> yield(name: "ignore")
alert(eventValue: eventTotal, threshold: 1)
Finally, we can call our custom alert() function. We pass in the eventTotal value as our eventValue and specify our threshold manually. Our Flux code all together looks like:
import "array"
import "slack"

option task = { name: "Event Alert", every: 1h0m0s, offset: 5m0s }

alert = (eventValue, threshold) =>
   (if eventValue >= threshold then slack.message(
       url: "https://hooks.slack.com/services/####/####/####",
       text: "An alert event has occurred! The number of field values= \"${string(v: eventValue)}\".",
       color: "warning",
   ) else 0)
data = from(bucket: "bucket1")
   |> range(start: -task.every, stop: now())
   |> filter(fn: (r) =>
       (r._measurement == "measurement1" and r._field == "field1" and exists r._value))
   |> sum()
data_0 = array.from(rows: [{_value: 0}])
events = union(tables: [data_0, data])
   |> group()
   |> sum()
   |> findRecord(fn: (key) =>
       (true), idx: 0)
eventTotal = events._value

data_0
   |> yield(name: "ignore")
alert(eventValue: eventTotal, threshold: 1)
Writing Data from OSS to Cloud with a Task
When it comes to writing data to InfluxDB, you have a lot of options. You can:
- Write data to an OSS instance on your edge or fog device
- Write data from your IoT device directly to your InfluxDB Cloud
- Write data to an OSS instance of InfluxDB on your edge device and push data to InfluxDB Cloud ad hoc.
The last bullet is the most powerful and flexible way of maintaining and managing your fleet of IoT devices. That architecture offers you several advantages including:
- The ability to perform tasks that prepare and clean your data before sending it to InfluxDB Cloud. This not only helps you create a well organized data pipeline but also ensure that your data has been standardized across IoT devices.
- The flexibility to only send select data to InfluxDB Cloud, like anomalies that were flagged in the OSS instance.
- The option to isolate task workloads and keep them close to the data source.
- The benefit of an additional layer of security between your edge devices and your InfluxDB Cloud instance and your end-customers.

Architecture drawing of the last bullet. Sensors write data to an OSS instance of InfluxDB at the edge with in turn write data to InfluxDB Cloud.
Using the to() function to consolidate data from OSS to InfluxDB Cloud.
One way you can achieve this architecture is by using the to() function. The to() function now supports the option to write data from an OSS v2.1 instance to a InfluxDB Cloud instance.
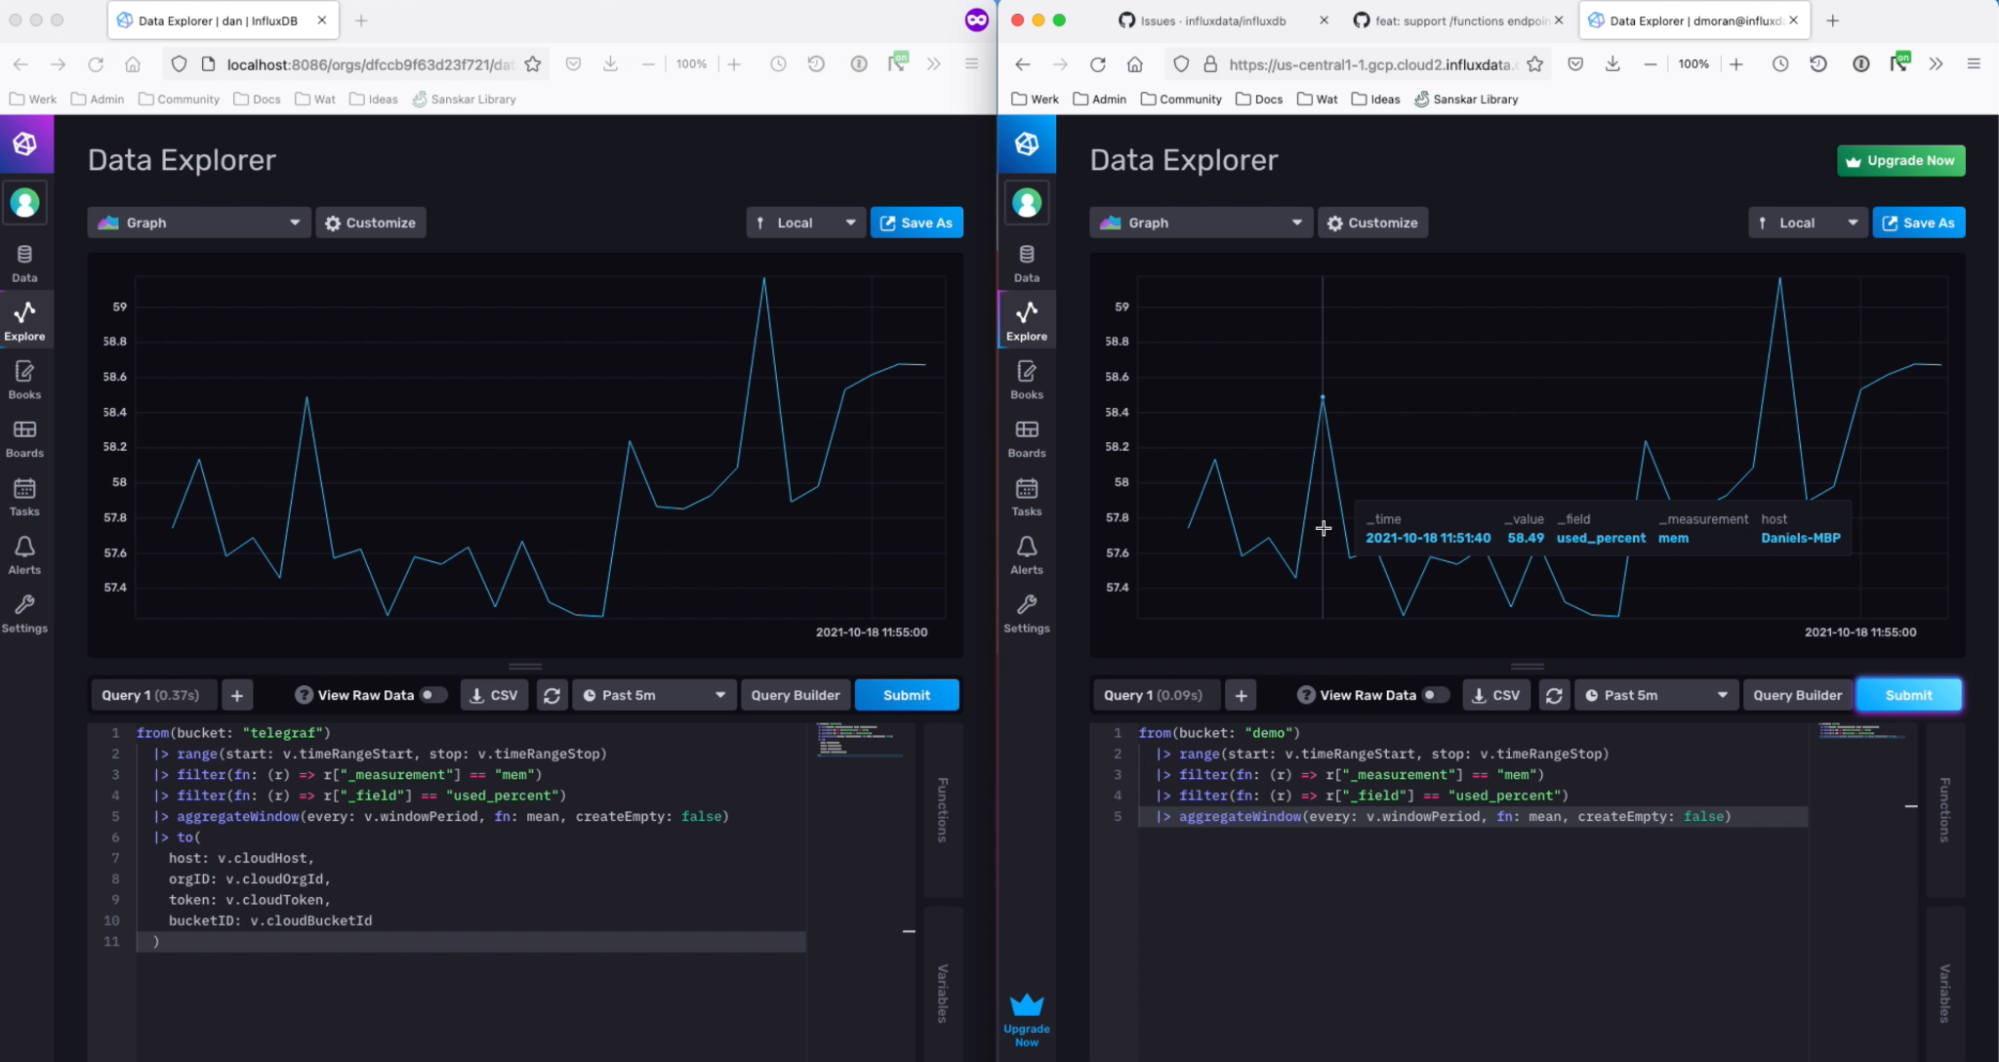 An example of using the to() function to write data from an OSS instance to InfluxDB Cloud. On the right hand side, the user is querying an OSS instance. On the right hand side an InfluxDB Cloud instance displays the results of the Flux script in the OSS instance after the data is written to InfluxDB Cloud with the to() function.
To write data with the to() function from InfluxDB Cloud:
- Query for your data.
from(bucket: "RoomSensors")
    |> range(start: -10m)
    |> filter(fn: (r) => r["_measurement"] == "temperature")
    |> filter(fn: (r) => r["_field"] == "temperature")
    |> aggregateWindow(every: v.windowPeriod, fn: mean, createEmpty: false)
- Specify the destination host URL, orgID, token, and bucket ID.
|> to(host: https://us-west-2-1.aws.cloud2.influxdata.com, orgID: XXX,token: XXX==, bucketID: XXX)
You’ll need to have an InfluxDB Cloud account first to try this out. A free tier account will work just fine for this. You can easily sign up for an account here. After you sign up, you’ll need to:
- Create a bucket.
- Create a token. Make sure that you’re using a token that has write permissions scoped to your destination bucket.
- Find your InfluxDB host url.
- Find your Org ID.
Limitations of and alternatives to the to() function.
The to() function offers an easy way to write data from an edge device to the Cloud. However, it comes with several limitations:
- Sent over HTTP
- No built-in functionality for failure handling
- No built-in functionality for batching, retries, or parallelization.
The to() function should only be used to consolidate data from OSS to Cloud if you meet the following conditions:
- You intend on downsampling your data first before writing it to Cloud to limit the size of the request.
- You have a small amount of devices or are writing a relatively small amount of data this way. You can’t use the to() function for large workloads because the data volume might cause a network failure. There also isn’t functionality built in for failure handling.
- You aren’t trying to overcome writing a large amount of data with micro-batching and generating a really high request count.
While the to() function has some limitations, there is another option for writing IoT Data from OSS to InfluxDB Cloud. You can use the mqtt.to() function to write data to a MQTT broker first if you want to handle larger workloads.
An acceptable usage of to() in a downsampling task
Now that we understand the limitations of the to() function. Let’s highlight an example where it could be successful. For this example we’ll assume we want to downsample and write data on a schedule with a task.
option task = {
    name: "downsample and consolidate task",
    every: 1d,
    offset: 10m,
}
import "http"
import "influxdata/influxdb/secrets"


myToken = "Token ${secrets.get(key: "cloud-token")}"
myUrl= "https://us-west-2-1.aws.cloud2.influxdata.com"
myOrgID = "Token ${secrets.get(key: "cloud-org")}"
myBucketID = "Token ${secrets.get(key: "cloud-bucket")}"


from(bucket: "sensorData")
|> range(start: -task.every)
|> filter(fn: (r) =>
(r["_measurement"] == "sensors"))
|> mean()
|> to(host: myurl, orgID:   myOrgID, token: myToken, bucketID: myBucketID)
This task aggregates all of the data from one measurement into one daily mean before writing it to InfluxDB Cloud.
Understanding the _task bucket
Every time you run a task, metadata about your task is stored in the default _task bucket. It contains the following schema:
- 1 measurement: runs
- 2 tags with the following tag values:
- status
- successful
- unsuccessful
- taskID
- The list of task ID’s for all of the tasks you’ve created
- status
- 9 field values:
- errorMessage
- finishedAt
- lastSuccess
- logs
- name
- requestedAt
- runID
- shceduledFor
- startedAt
This data can help you debug and manage your tasks. We’ll go into more detail about how you might use the data in this bucket in the subsequent sections.
Debug and manage a Task with the UI
To debug a task with the UI navigate to the Tasks page and click on your task name or Downsampled and transformed tasks for example.
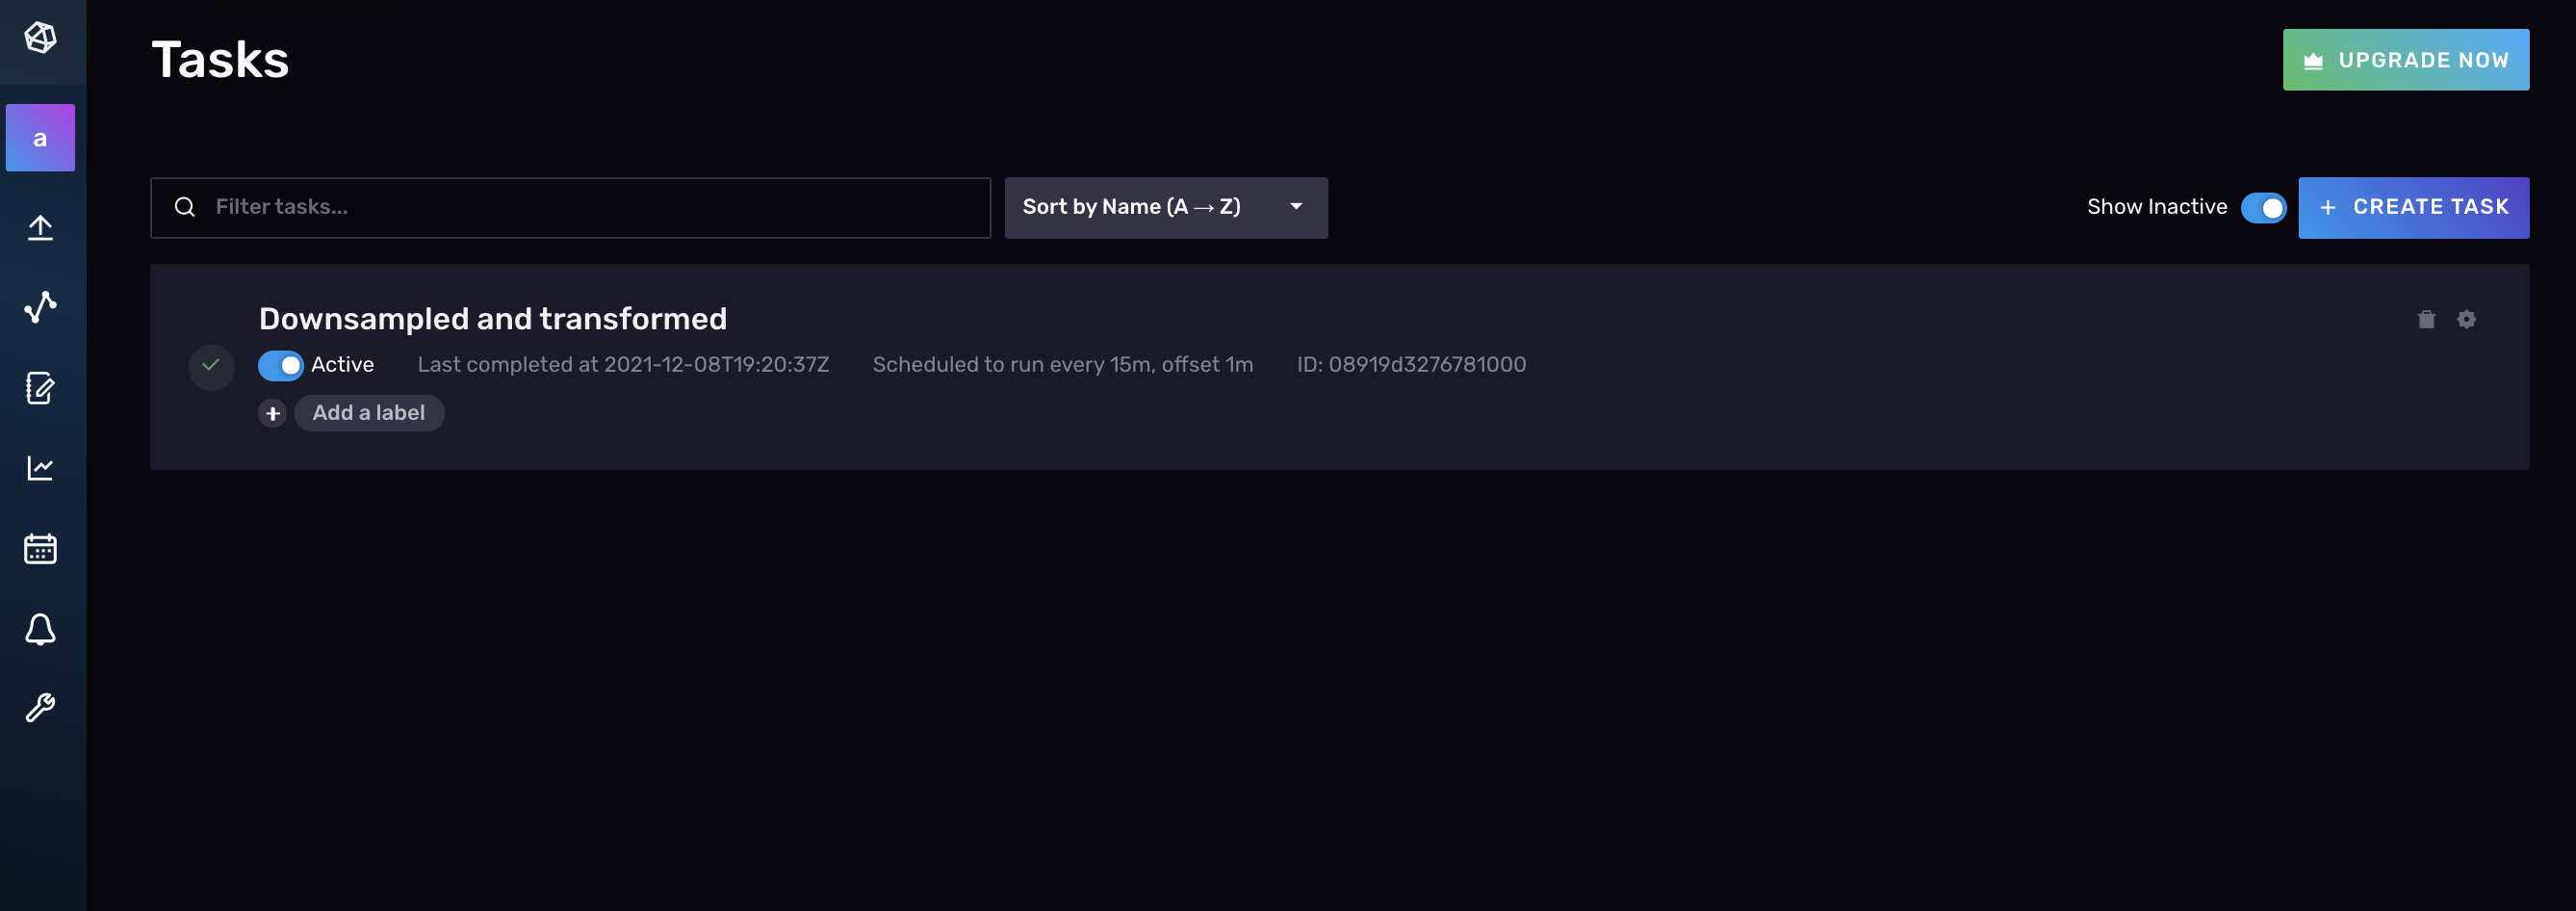
From here you can see the list of task runs that have been scheduled. You can determine whether or not the task ran successfully, when the run started, and how long the run took to execute. You can also elect to Run Task immediately. This is especially useful when you’re debugging your task because you don’t want to wait until the next time the task is scheduled to run to verify that your changes correct the issue. You want to be able to test that your task runs successfully immediately. Lastly, you can change the status of your task from active to inactive with the toggle on the directly below the task name to stop the task from running.

You can also select View Logs for a specific run to see the detailed logs for that run. Any error messages will appear here which can help you to debug your task.
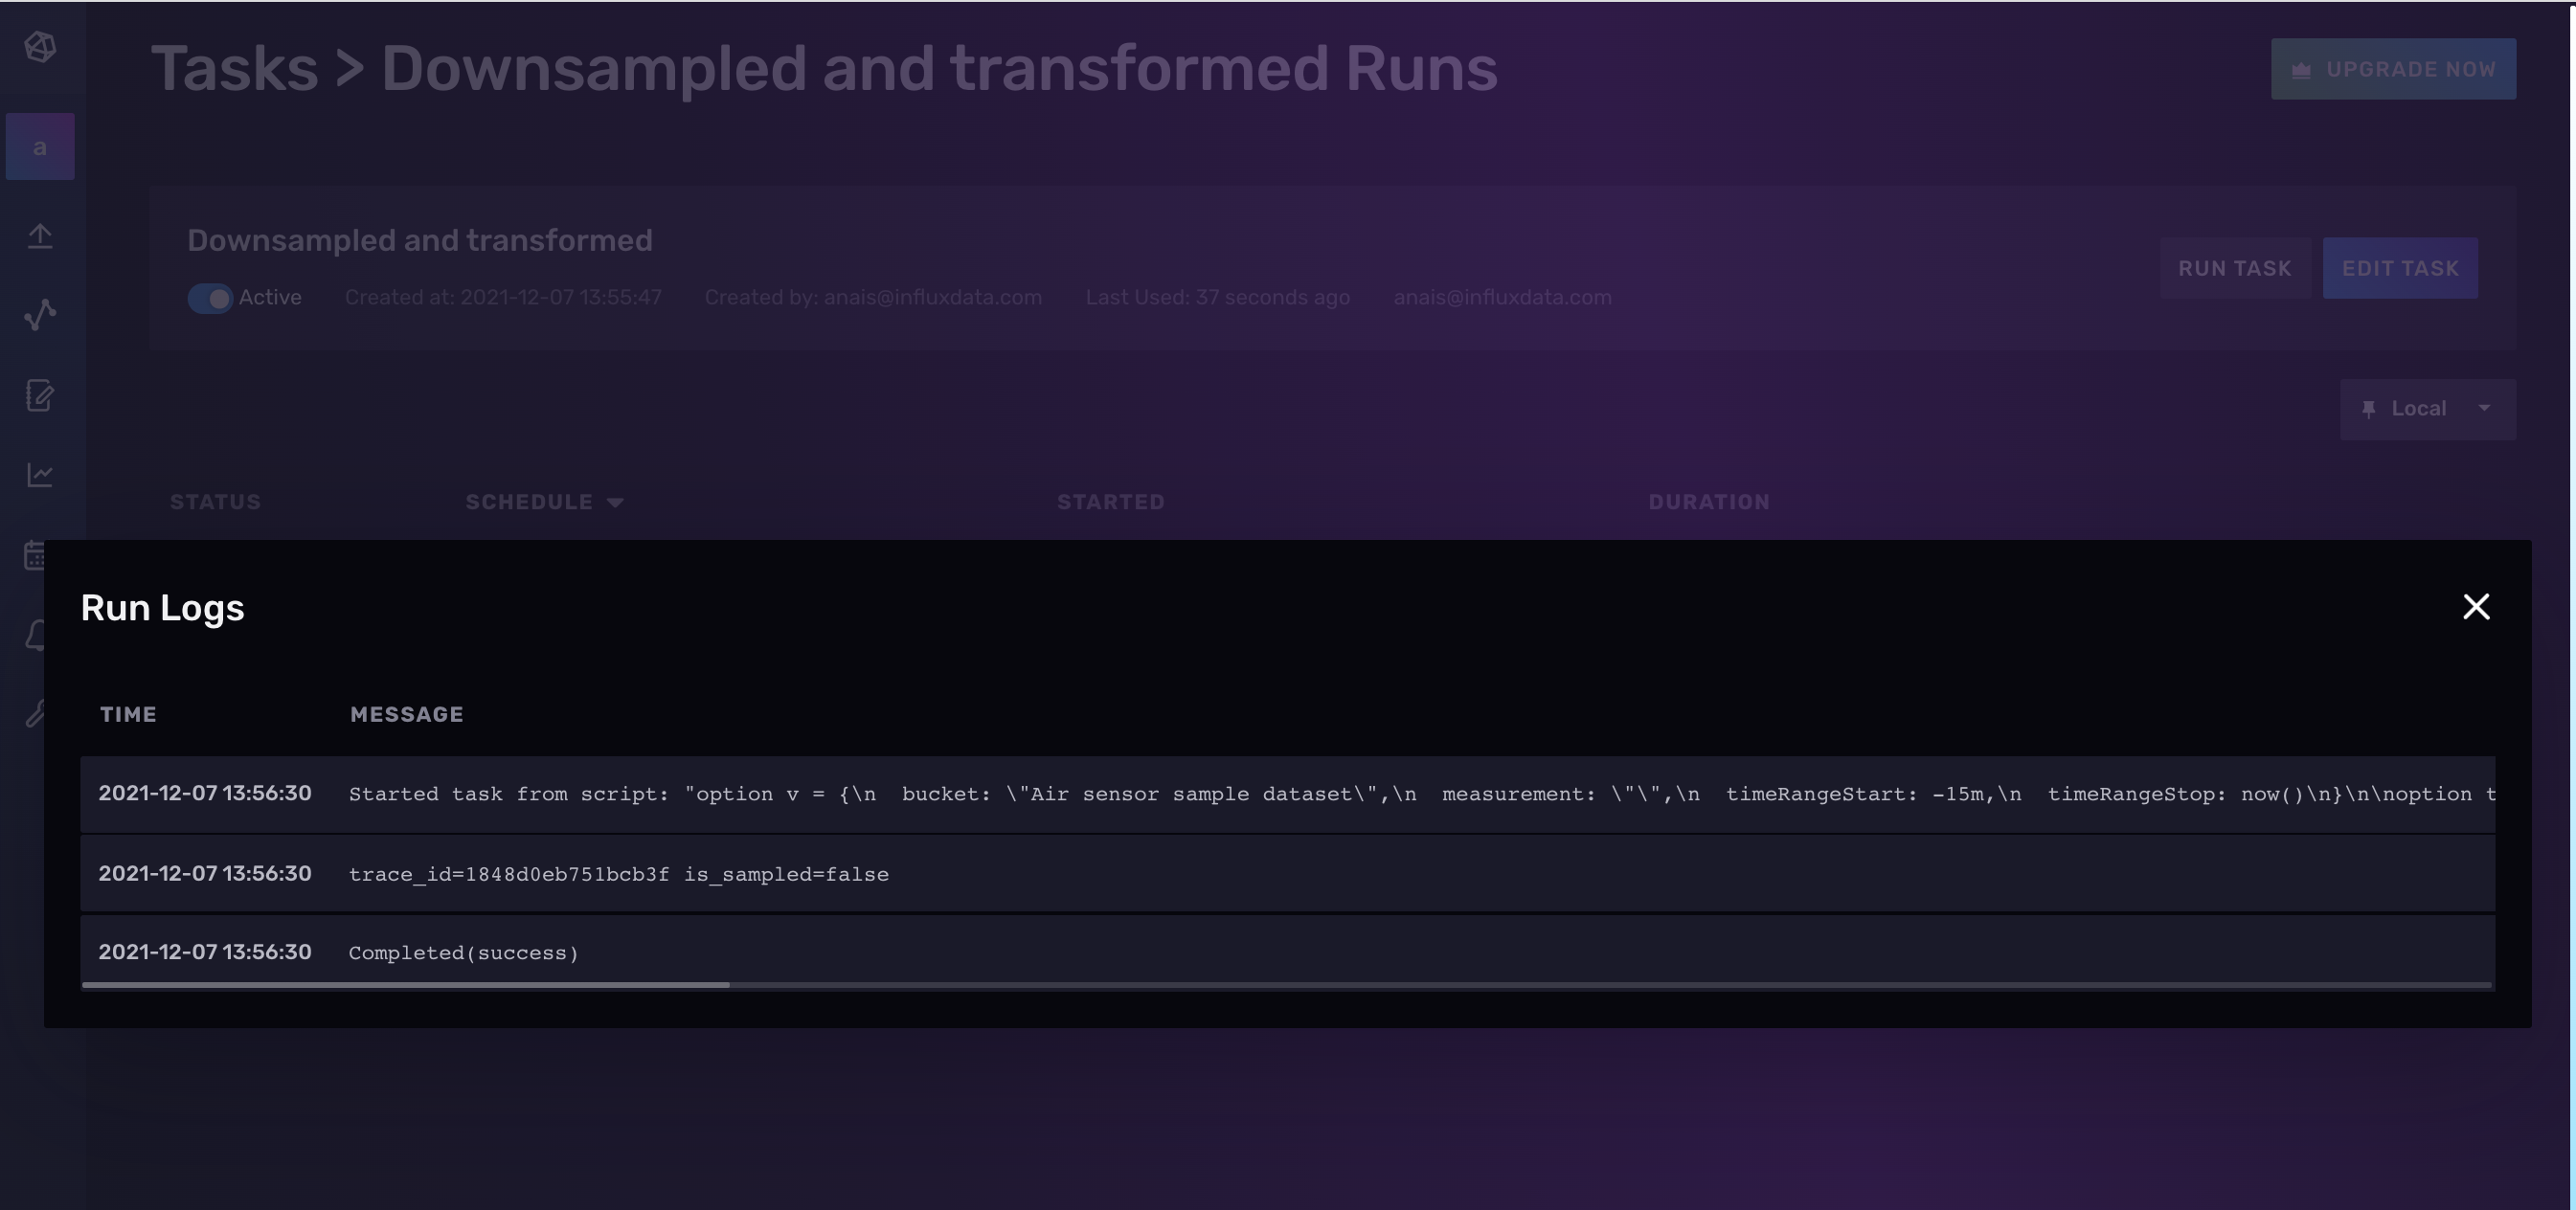
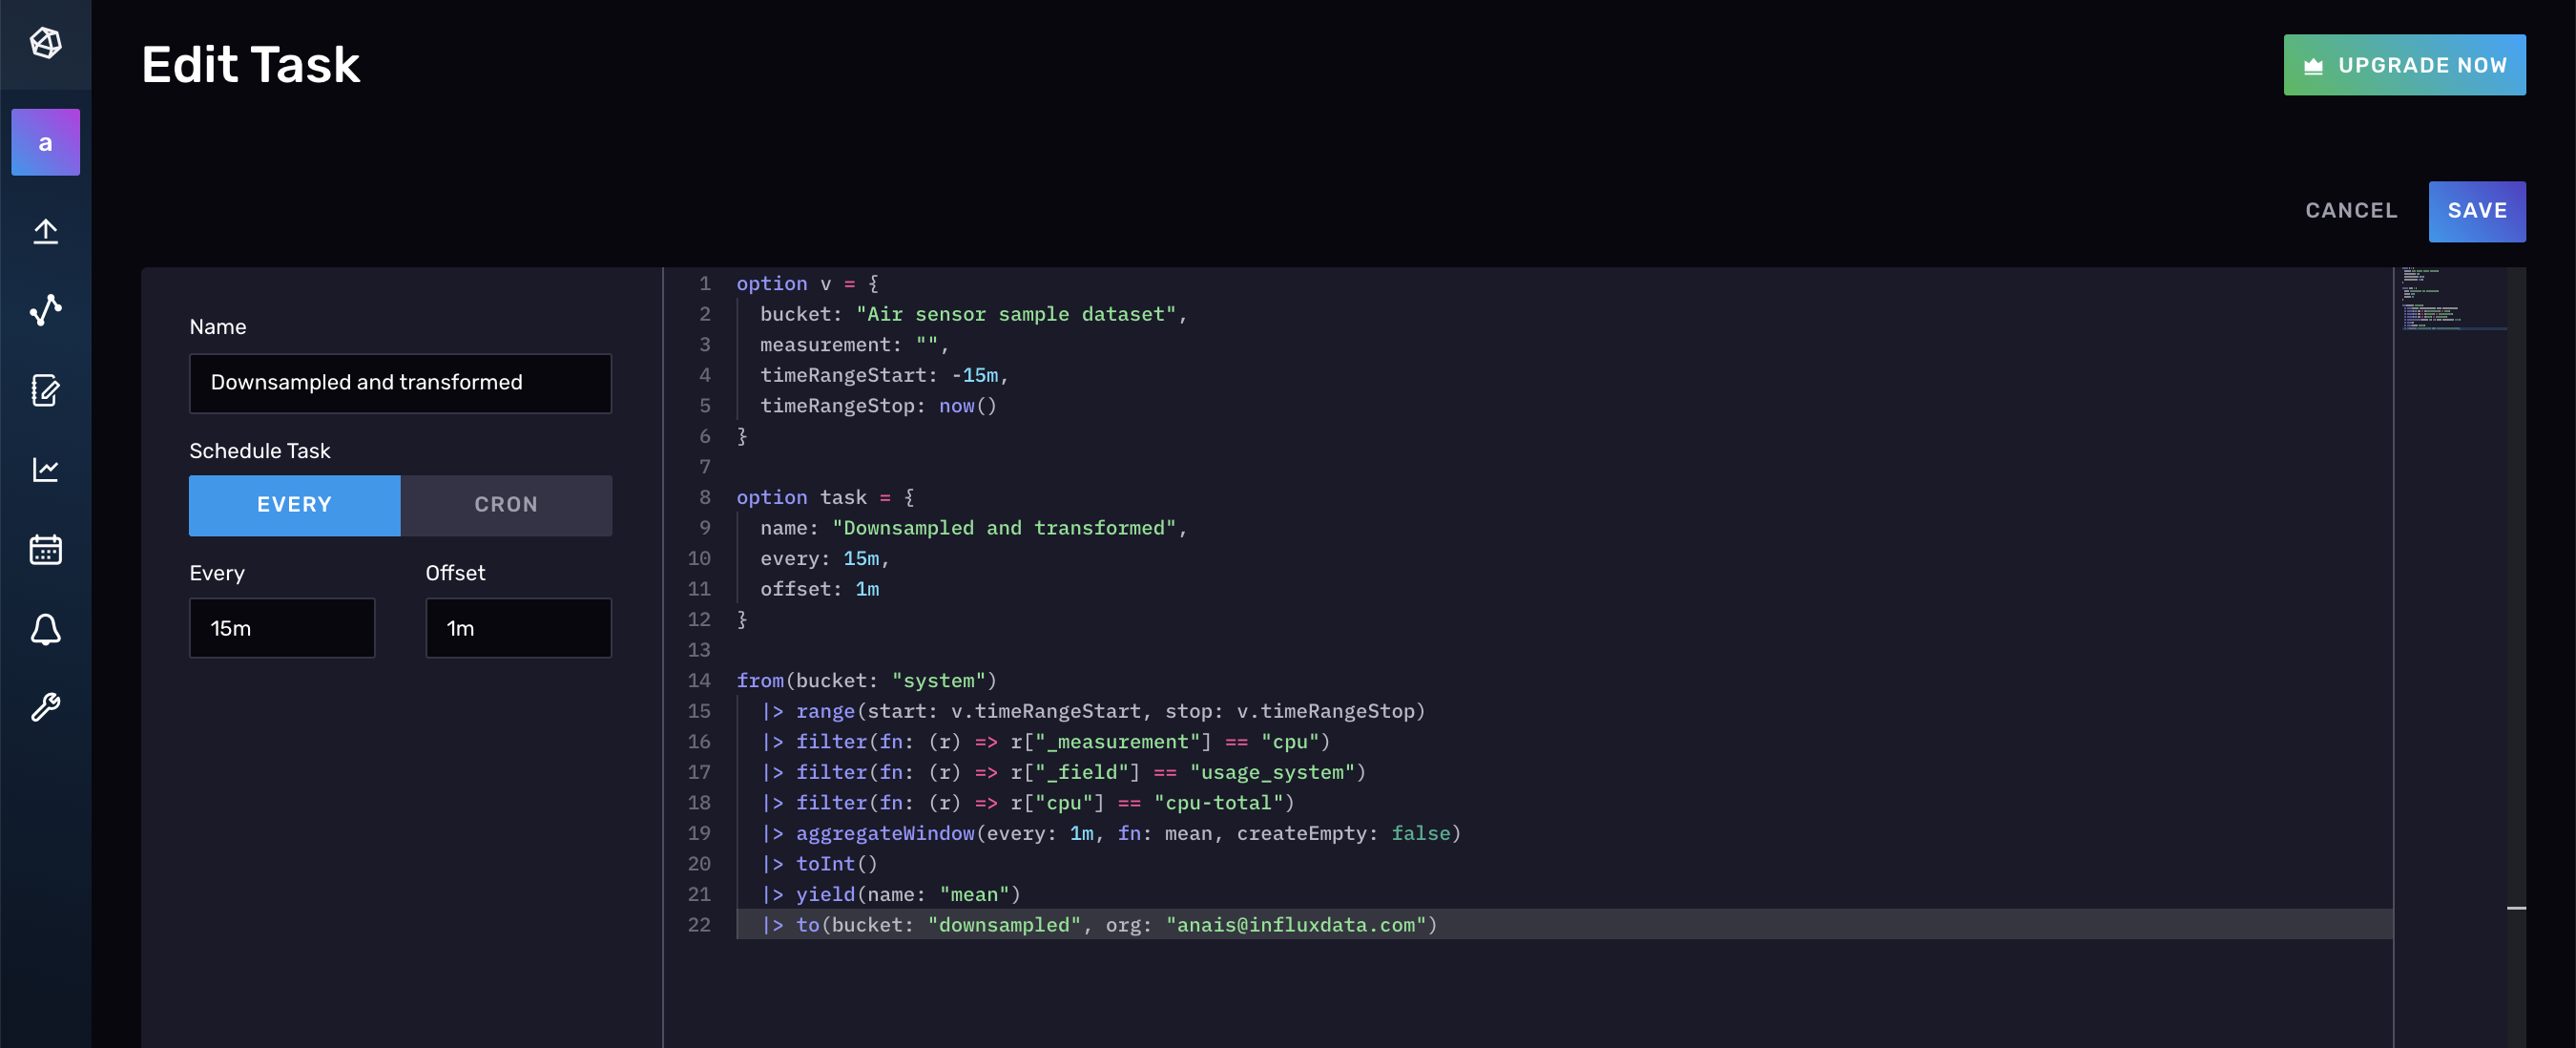
If you close the Run Logs window and return back to your task, click Edit Task to view the Flux that was auto generated from creating a task with the InfluxDB UI. You can also make edits to the underlying Flux here.
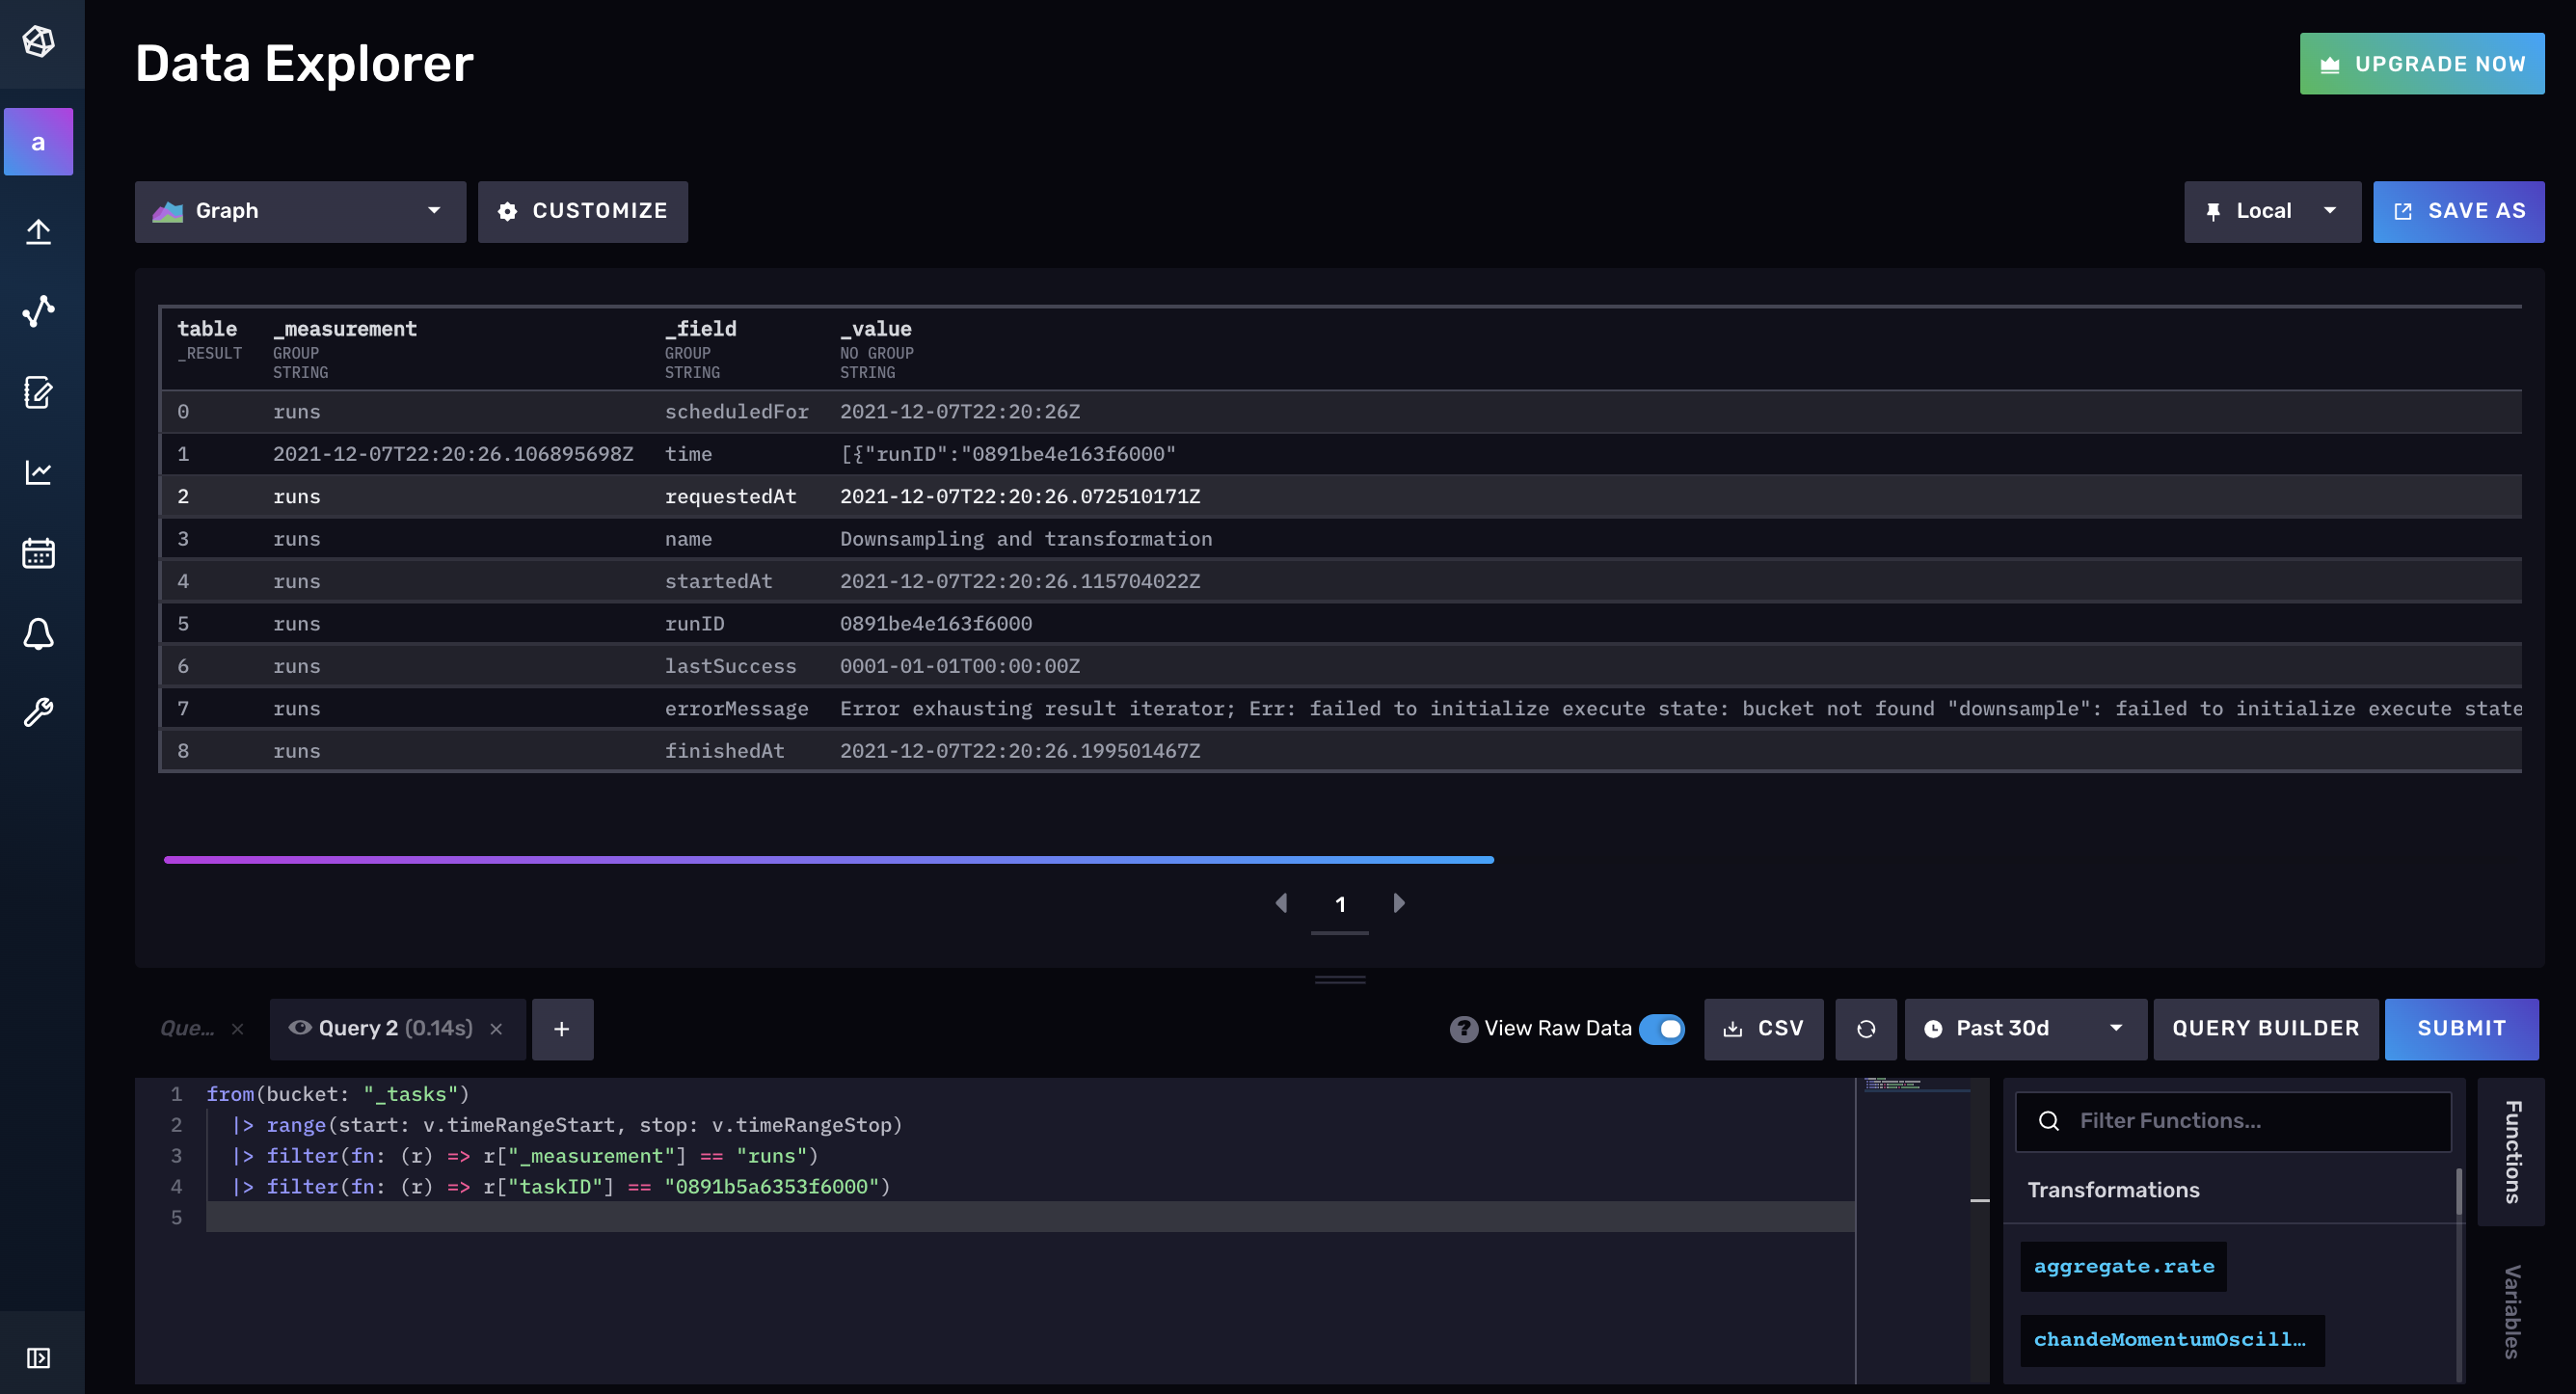
Lastly, you can query the _task bucket to return metadata about your task to help you debug your task. For example, by identifying the last successful run of your task you can more easily pinpoint changes in your system that caused your task to fail.
Debug and manage a Task with the InfluxDB API v2
There are a wide variety of task actions you can perform with the InfluxDB API v2.
List all tasks with:
curl --location --request GET 'http://us-west-2-1.aws.cloud2.influxdata.com/api/v2/tasks?org =anais@influxdata.com' \
--header 'Authorization: Token XXX=='
This request produces the following response:
 {"links":{"labels":"/api/v2/tasks/0891b50164bf6000/labels",
           "logs":"/api/v2/tasks/0891b50164bf6000/logs",
           "members":"/api/v2/tasks/0891b50164bf6000/members",
           "owners":"/api/v2/tasks/0891b50164bf6000/owners",
           "runs":"/api/v2/tasks/0891b50164bf6000/runs","self":"/api/v2/tasks/0891b50164bf6000"},
           "labels":[],
           "id":"0891b50164bf6000",
           "orgID":"XXX",
           "org":"anais@influxdata.com",
           "ownerID":"XXX",
           "name":"mytask",
           "description":"downsamples total cpu usage_user data into 5m averages every 10m",
           "status":"active",
           "flux":"option task = {name: \"mytask\", every: 10m, offset: 1m}\n from(bucket: \"system\")\n |\u003e range(start: -task.every)\n |\u003e filter(fn: (r) =\u003e r[\"_measurement\"] == \"cpu\")\n |\u003e filter(fn: (r) =\u003e r[\"_field\"] == \"usage_user\")\n |\u003e filter(fn: (r) =\u003e r[\"cpu\"] == \"cpu-total\")\n |\u003e aggregateWindow(every: 5m, fn: mean, createEmpty: false)\n |\u003e to(bucket: \"downsampled\")\n",
           "every":"10m",
           "offset":"1m",
           "latestCompleted":"2021-12-07T22:10:00Z",
           "lastRunStatus":"success",
           "createdAt":"2021-12-07T21:39:48Z",
           "updatedAt":"2021-12-07T22:20:16Z"}
You can retrieve a specific task as well by supplying the task ID in the URL with:
curl --location --request GET 'http://us-west-2-1.aws.cloud2.influxdata.com/api/v2/tasks/0891b50164bf6000' \
--header 'Authorization: Token XXX=='
In this instance the request will return the same response as the previous request to list all tasks because we only have one task.
You can edit a task with the InfluxDB API v2 similar to how you created a task. This also allows you to change the status of your task.
curl --location --request PATCH 'http://us-west-2-1.aws.cloud2.influxdata.com/api/v2/tasks/0891b50164bf6000' \
--header 'Authorization: Token XXX==' \
--header 'Content-Type: application/json' \
--data-raw '{"description": "updated my task",
"every": "10m",
"flux": "<new flux script with task options included>",
"name": "new name",
"offset": "1m",
"status": "inactive"}'
Debug and manage a Task with the CLI
Use the influx task list command to list all tasks and their corresponding Name, task IDs, Organization, Status, Every, Cron values.
For example running influx task list returns the following:
ID			Name	Organization                        ID		            Organization		    Status		Every	Cron
0891b50164bf6000 	Downsampled and transformed			0437f6d51b579000	anais@influxdata.com	inactive	15m
Use the influx task log list command to list the logs for a specific run by specifying a run ID. The easiest way to get a run ID is to perform the following query:
influx task log list --task-id 0891b50164bf6000 --run-id 0891b54779033002
This command produces the following output:
RunID			    Time					                Message
0891b54779033002	2021-12-07 21:41:00.055420881 +0000 UTC	Started task from script: "option task = {name: \"mytask\", every: 10m, offset: 1m}\n from(bucket: \"system\")\n |> range(start: -task.every)\n |> filter(fn: (r) => r[\"_measurement\"] == \"cpu\")\n |> filter(fn: (r) => r[\"_field\"] == \"usage_user\")\n |> filter(fn: (r) => r[\"cpu\"] == \"cpu-total\")\n |> aggregateWindow(every: 5m, fn: mean, createEmpty: false)\n |> to(bucket: \"downsampled\")\n"
0891b54779033002	2021-12-07 21:41:00.33920522 +0000 UTC	trace_id=24cfcf9895f08ea9 is_sampled=false
0891b54779033002	2021-12-07 21:41:00.671075325 +0000 UTC	Completed(success)
You can get the run ID by querying the _task bucket.
from(bucket: "_tasks")
|> range(start: -1h)
|> filter(fn: (r) => r["_measurement"] == "runs")
|> filter(fn: (r) => r["_field"] == "runID")
|> filter(fn: (r) => r["status"] == "success")
|> filter(fn: (r) => r["taskID"] == "0891b50164bf6000")
|> yield(name: "runID")
Now, update a task by using the influx task update command and passing in the file location to your new Flux script.
influx task update --id 0891b50164bf6000 --file /path/to/example-task.flux
Activate or deactivate a task with the same command but using the –status flag instead.
influx task update --id 0891b50164bf6000 --status inactive
Further Reading
- TL;DR InfluxDB Tech Tips: Debugging and Monitoring Tasks with InfluxDB
- TL;DR InfluxDB Tech Tips: IoT Data from the Edge to Cloud with Flux
- TL;DR InfluxDB Tech Tips – Monitoring Tasks and Finding the Source of Runaway Cardinality
- Downsampling with InfluxDB v2.0
- TL;DR InfluxDB Tech Tips – How to Monitor States with InfluxDB
- TL;DR InfluxDB Tech Tips – Using Tasks and Checks for Monitoring with InfluxDB